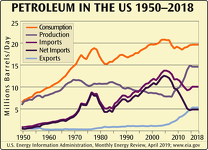
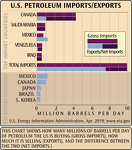
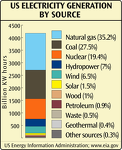
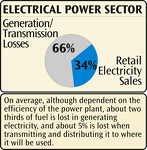
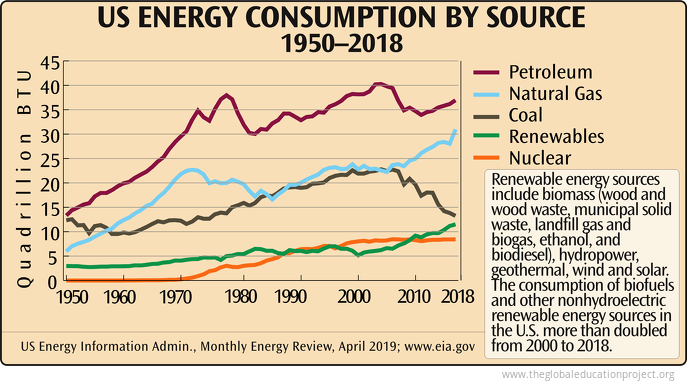
Chart of US Energy Consumption by Source 1950-2018
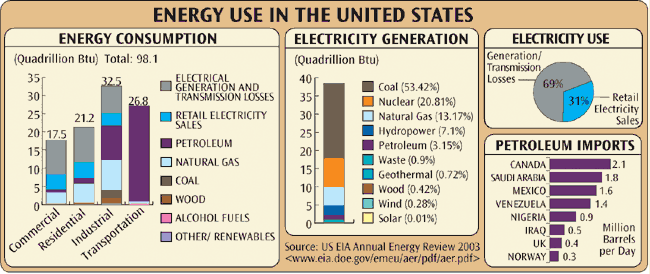
2005 version of this chart
Sources
Tags: energy consumption by source, historical energy consumption, natural gas, petroleum, coal, nuclear energy, renewable energy, us energy consumption by source 1950-2018, fossil-fuel
Sign up for EARTH Dispatches
Enter you email below to get jaw dropping charts and maps delivered straight to your inbox.
Get the EARTH presentation
A 150 page high-resolution PDF containing all updated maps, charts and data on EARTH website; use as an information-packed educational slide show, printed booklet or a set of single-page handouts.
Learn More
