Fishing & Aquaculture
Fisheries and aquaculture; fish consumption and utilization; what countries claim as Exclusive Economic Zones (EEZs), and how heavily the world's fish stocks are being exploited; oil in the ocean; coral reefs.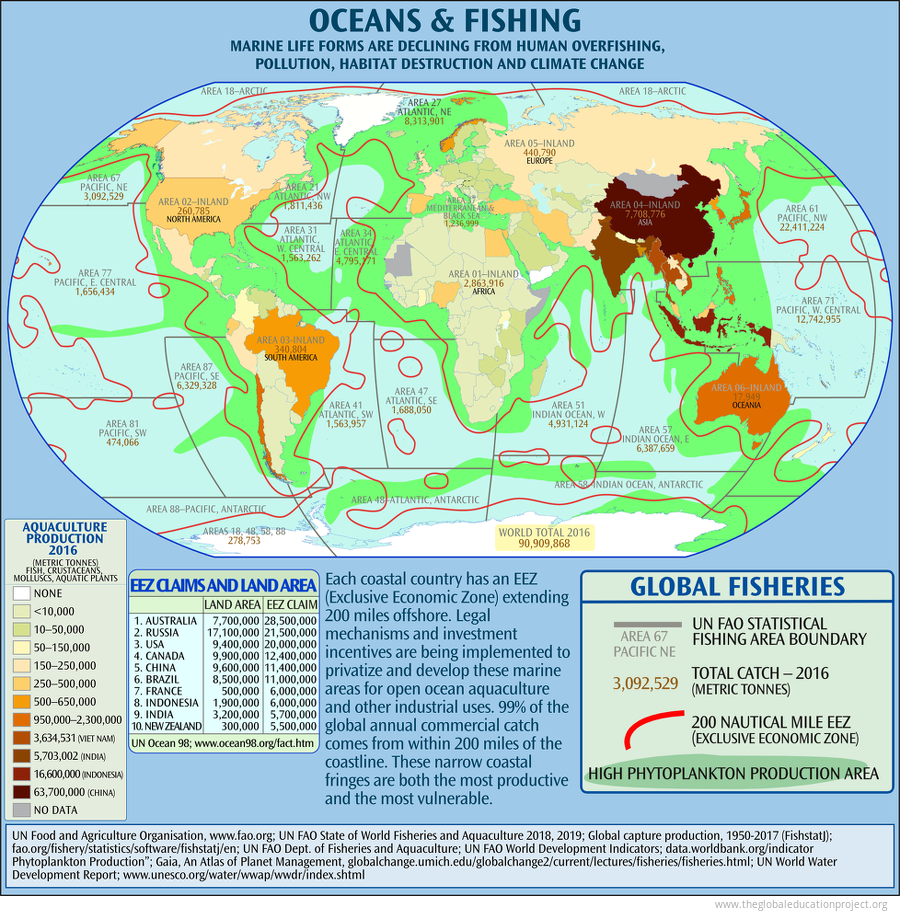 Each coastal country has an EEZ extending 200 miles offshore. “99% of the worldwide annual commercial ocean catch comes from coastal waters... these narrow coastal fringes are both the most productive and the most vulnerable.” Legal mechanisms and investment incentives are being implemented to privatize and develop these marine areas for open ocean aquaculture–exploitation that is beyond state or provincial regulation. Areas where an ice shelf extends beyond the coastline are also a source of potential dispute.
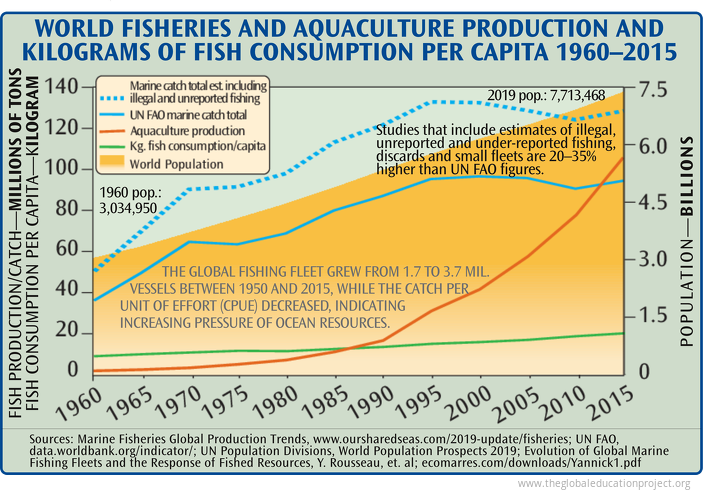
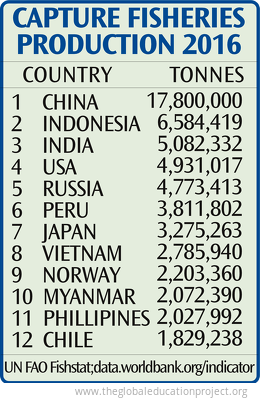
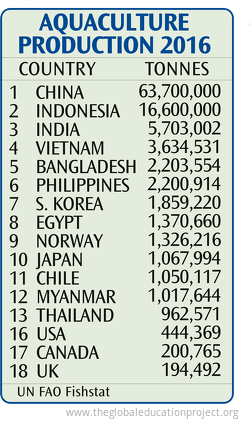 AQUACULTURE is the industrial farming in fresh or salt water of fish, mollusks, crustaceans and plants.
Aquaculture is rapidly increasing its annual global harvest and seems to offer hope for increased food production. However, for some of the more than 210 farmed aquatic animal and plant species, particularly salmon and shrimp, the methods currently used require high energy inputs and can cause environmental degradation similar to industrial/chemical agriculture or factory farming of livestock. These include loss of natural habitat, loss of genetic diversity, and replacement of self reliant indigenous fisheries with multinational corporations. Pollution from concentrated sewage can smother the benthic (bottom dwelling) organisms, over-fertilize the water and lead to toxic algae blooms. (A single fin fish farm may output as much daily sewage as a small city.)
High stress overcrowding contributes to epidemic disease remedied by routine vaccinations and antibiotic treatments, cultivating drug resistant pathogens and impacting other aquatic wildlife.
High concentrations of pathogens/parasites on the farm can infect the natural environment threatening local species; escaped domesticated farm fish can threaten local species with extinction through genetic pollution.
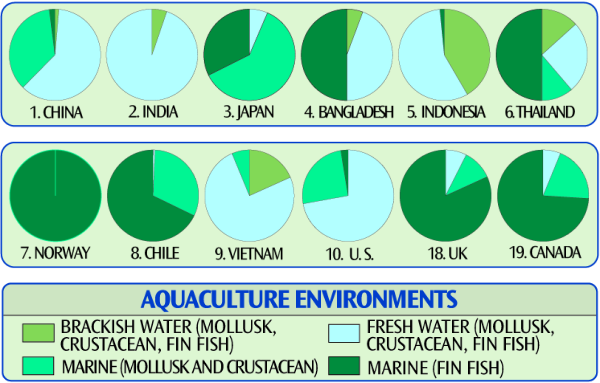 The high protein feed for farmed salmon is largely composed of ocean caught fish meal and meat offal from poultry and hog processing. Because of bio-accumulation of toxins in the feed, "consumption of farmed salmon even at relatively low frequencies results in elevated exposure to dioxins and dioxin-like compounds with commensurate elevation in estimates of health risk." Farming of shrimp in Asia has lead to significant destruction of natural mangrove ecosystems.
Genetically engineered fish are being readied for commercial production in open net pens.
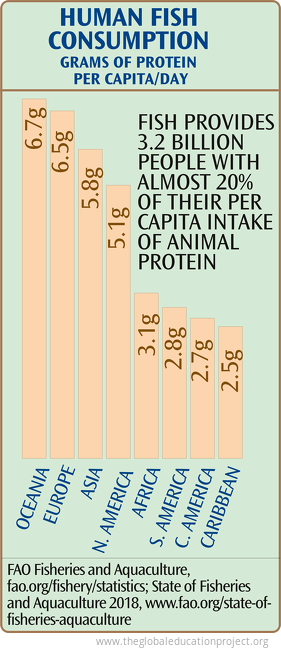 In 2015, fish accounted for about 17% of animal protein, and 7% of all proteins, consumed by the global population. Since 1961, the global average annual increase in fish consumption for food has outpaced population growth and exceeded consumption of meat from all terrestrial animals except poultry.
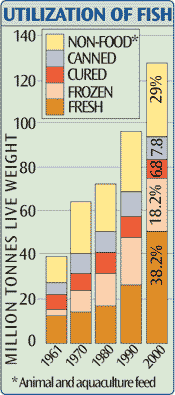 In 2017 around 22% of total global capture fisheries were used for non-direct human use, including fishmeal and direct feed, a large portion of which is used in aquaculture production.
"If four tonnes of wild caught anchovies are required as feed to produce one tonne of aquaculture-raised salmon, one cannot say that humanity has five tonnes of fish... Humanity has either four tonnes of anchovies, which are excellent eating and highly nutritious, or one tonne of salmon, but not both....It is probably correct that aquaculture will generally continue to grow and contribute to the food provision of more and more people...However, aquaculture cannot do this if it relies on fish that can also be eaten directly by people." [1]
Corals
Coral reefs cover less than 1% of the ocean floor but are habitat for at least 25% of all known marine life. Most coral reefs occur in shallow water near shore, so they are particularly vulnerable to pollution and the effects of human activities. 71% of all known reef-forming coral species are assessed as susceptible to climate change—a greater proportion than any other species group. Increased ocean temperatures and changing ocean chemistry caused by warmer atmospheric temperatures and increasing levels of carbon dioxide in seawater are the greatest global threats to coral reef ecosystems. Rising sea temperature increases algae growth so oxygen levels become too high for the coral, causing "bleaching"—the coral expels the algae and dies. In April 2020, Australia's Great Barrier Reef experienced the third widespread mass bleaching event of the last five years. Roughly one-third of the world’s coral reef systems have been destroyed or highly degraded and are among the most threatened ecosystems on Earth, showing the highest loss in biodiversity.Sources
Global Aquaculture and Fisheries Map:
OCEANS MAP SOURCES: “Political Map of the World, April 2004”; Perry Castaneda Map Library, www.lib.utexas.edu/maps/
EEZs and FAO FISHING AREA BOUNDARIES: United Nations Food and Agriculture Organisation, www.fao.org/docrep/U8480E/U8480E0f.htm
CAPTURE AND AQUACULTURE PRODUCTION:
UN FAO The State of World Fisheries and Aquaculture 2018 and UN FAO Fishery and Aquaculture Statistics 2019; www.fao.org
Global Capture Production, 1950-2017 (FishstatJ), updated 2019. www.fao.org/fishery/statistics/software/fishstatj/en;
UN FAO Department of Fisheries and Aquaculture: World Development Indicatores; data.worldbank.org/indicator
PHYTOPLANKTON: Phytoplankton Production”; Gaia, An Atlas of Planet Management, globalchange.umich.edu/globalchange2/current/lectures/fisheries/fisheries.html
TEXT: [1.] UN World Water Development Report, www.unesco.org/water/wwap/wwdr/index.shtml [2.] IUCN: Species Susceptibility to Climate Change Impacts; iucn.org/downloads/climatic_c; [3.] World Summit on Sustainable Development 2002, “A Framework for Action on Biodiversity & Ecosystem Management”, www.johannesburgsummit.org/html/documents/wehab_papers.html
Total World Fisheries and Aquaculture Production Per Capita Chart:
Marine Fisheries Global Production Trends, www.oursharedseas.com/2019-update/fisheries
UN FAO, www.fao.org
UN Population Divisions, World Population Prospects 2019 data.worldbank.org/indicator/
"Evolution of Global Marine Fishing Fleets and the Response of Fished Resources"; Y. Rousseau, et. al; ecomarres.com/downloads/Yannick1.pdf
Fisheries Capture by Country Table:
UN FAO Fishstat; data.worldbank.org/indicator
Aquaculture Production by Country Table:
UN FAO Fishstat 2019
Aquaculture Environments by Country Chart:
UN FAO FISHSTAT Database: http://www.fao.org/fi/statist/FISOFT/FISHPLUS.asp
Fish Consumption By Region Chart:
FAO Fisheries and Aquaculture, fao.org/fishery/statistics
State of Fisheries and Aquaculture 2018, www.fao.org/state-of-fisheries-aquaculture
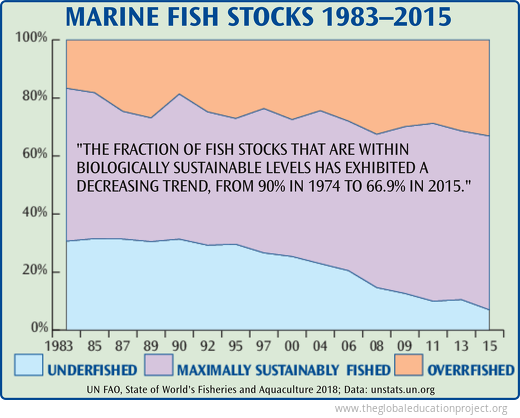
Marine Fish Stocks Chart:
UN FAO, State of the World's Fisheries and Aquaculture 2018; Data: unstats.un.org
Utilization of Fish Chart:
UN FAO: State of the World Fisheries and Aquaculture 2002, www.fao.org/fi/default.asp;
Text: [1.] Pauly D, and Zeller D (2017) Comments on FAOs State of World Fisheries and Aquaculture, 2016. Marine Policy 77: 176-181; www.seaaroundus.org/dr-dirk-zeller-publications/
Corals Text:
IUCN: Species Susceptibility to Climate Change Impacts
http://iucn.org/downloads/climatic_change_chapter_en_final.pdf
IUCN: Red List of Threatened Species; iucnredlist.org/
World Summit on Sustainable Development 2002, “A Framework for Action on Biodiversity & Ecosystem Management”, www.johannesburgsummit.org/html/documents/wehab_papers.html
Tags: fisheries, aquaculture, fish stocks, corals, eezs, oil spills, tanker spills, fishing & aquaculture
Sign up for EARTH Dispatches
Enter you email below to get jaw dropping charts and maps delivered straight to your inbox.
Get the EARTH presentation
A 150 page high-resolution PDF containing all updated maps, charts and data on EARTH website; use as an information-packed educational slide show, printed booklet or a set of single-page handouts.
Learn More
