Climate
Historical and contemporary overview of greenhouse gas emissions and atmospheric concentrations—which countries emit the most CO2, total and per capita; methane; ocean warming and sea level rise; global temperature projections; glacier and ice loss.Greenhouse Gases
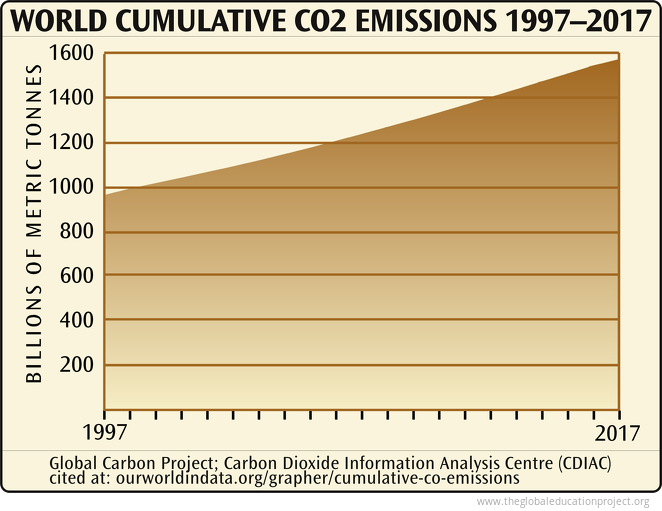
Higher concentrations of carbon dioxide, methane and other greenhouse gases, mainly as the result of human use of fossil fuels, have been determined to be the predominant cause of earth's changing climate. Geological history shows that as levels of atmospheric greenhouse gases increased, the earth warmed. Climate change will likely be one of the main drivers of extinction in the 21st century because of the speed at which average temperatures are warming—faster than at any time in the last 15,000 years.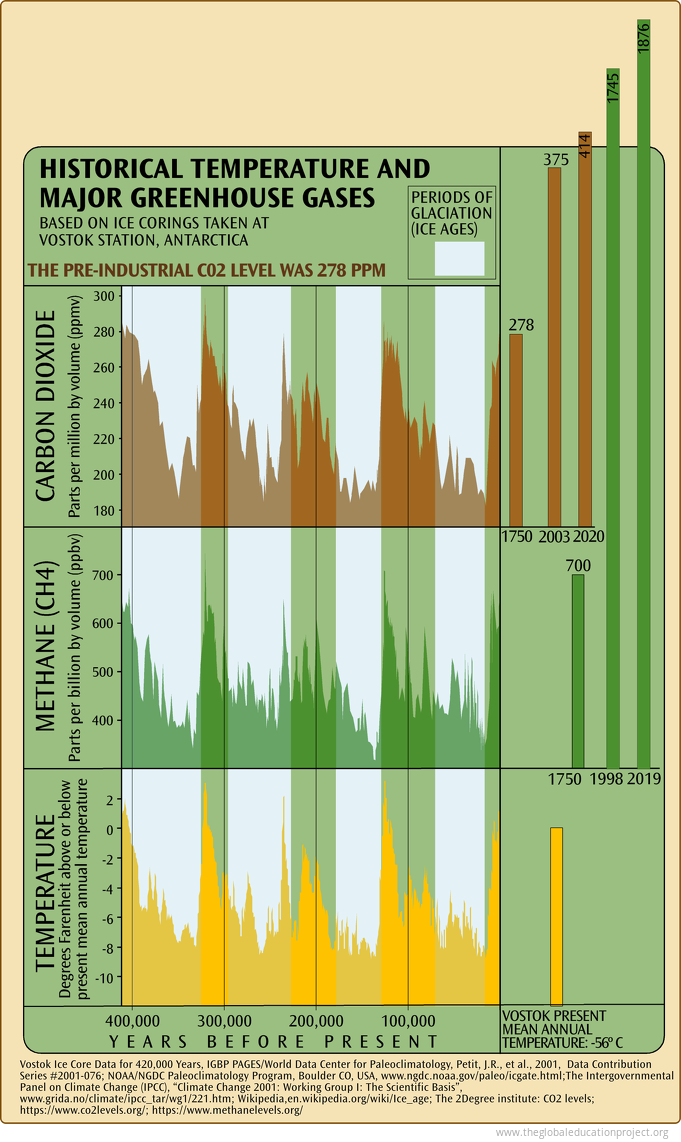 CO2 concentrations are well above historic maximum levels.* The GWP (Global Warming Potential) of methane gas (CH4) is greater than the GWP of CO2. Warming could release vast quantities of CH4 from thawing tundra and seabed methane hydrates.
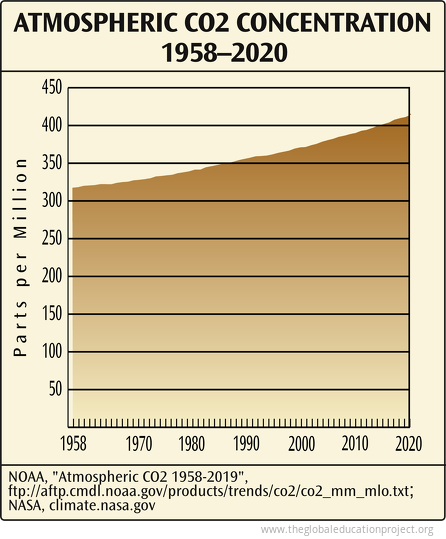
*Levels of CO2 continue to increase, measuring 415.25 PPM in January, 2021
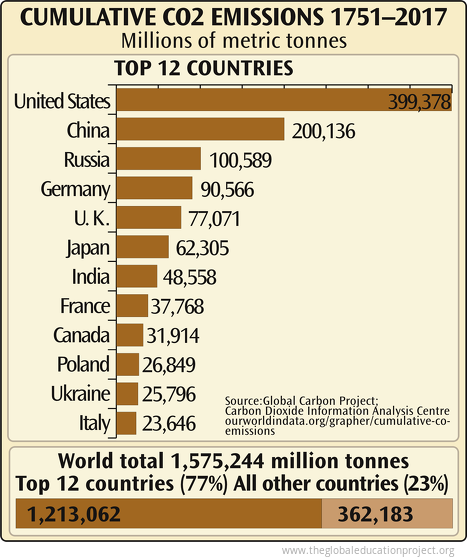
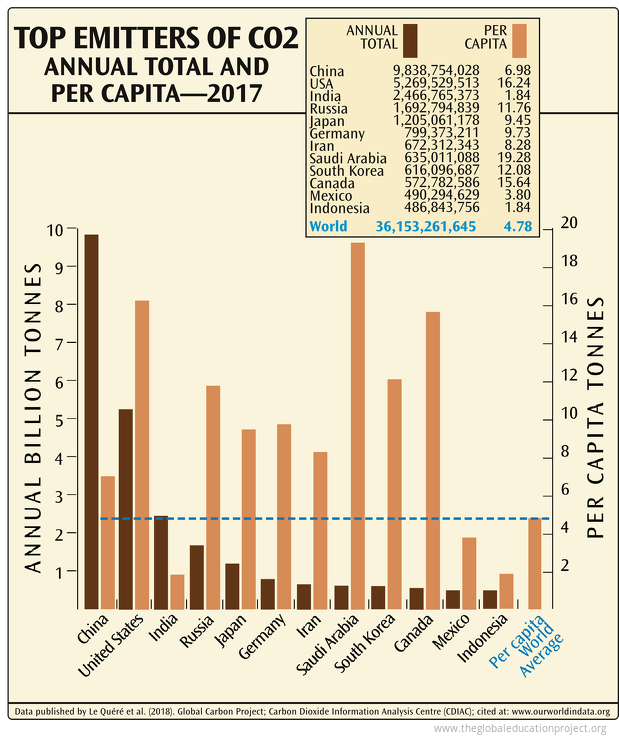 Research reported in 2017 shows that just 100 fossil fuel producers emitted 71% of global industrial greenhouse gases from 1988 to 2015.
51% of industrial emissions since 1988 can be linked to just 25 producers, including both public and state-owned entities.
Methane
Methane is less abundant than carbon dioxide and persists in the atmosphere for decades, rather than, like carbon dioxide, for centuries. However, methane has a global warming potential 84 to 87 times greater than CO2 over a 20 year period—or 28 to 36 times greater over a 100 year period. More than 60% of global methane emissions are from human activities, including: decomposition of landfill and livestock waste, digestion of domestic livestock, processing of natural gas and coal, wastewater treatment, and rice cultivation.Methane hydrates are molecules of methane trapped inside a “cage-like lattice of ice.” Large amounts of these deposits exist under the Arctic permafrost, in offshore ice shelves and in ocean sediments. While it remains frozen, permafrost is impermeable to methane and acts as a shut-off valve for any free gas.
As permafrost thaws with continued Arctic warming, methane emissions could reach the atmosphere, potentially causing more warming. The USGS has listed Arctic hydrate destabilisation as one of four most serious scenarios for abrupt climate change.
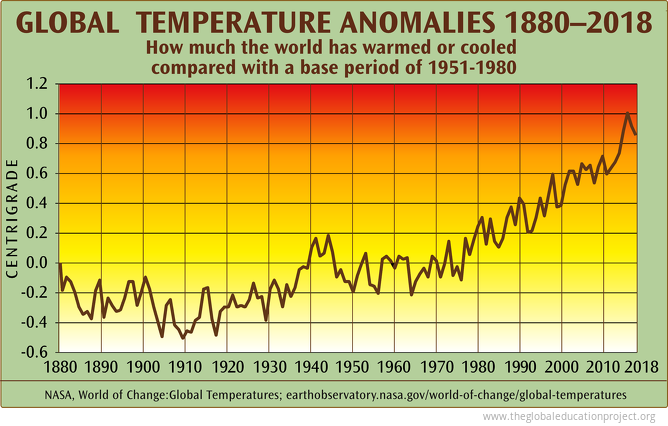 "Eighteen of the 19 warmest years all have occurred since 2001, with the exception of 1998. The year 2016 ranks as the warmest on record. This research is consistent with similar constructions prepared by the Climatic Research Unit and the National Oceanic and Atmospheric Administration." NASA/GISS
Solar Energy
Tiny atmospheric particles—aerosols—are a subset of air pollution that can have an effect on climate change. Light-coloured particles containing little or no carbon reflect incoming energy from the sun in cloud-free air. Dark particles containing substantial amounts of black carbon (e. g., soot produced from combustion of fossil fuels, biofuels, forest fires, etc.) absorb solar radiation before it reaches the ground and also acts as a shade so that the ground surface can become cooler. Scientists estimate that particles produced by human activities have led to a net loss of solar energy (heat) by as much as 8% percent in densely populated areas over the past few decades. This effect, sometimes referred to as ‘solar dimming,’ may have masked some global warming due to heat-trapping gases. However, the effect of long-lived global warming emissions far outweighs the cooling effect of short-lived atmospheric particles.Sea Ice and Glaciers
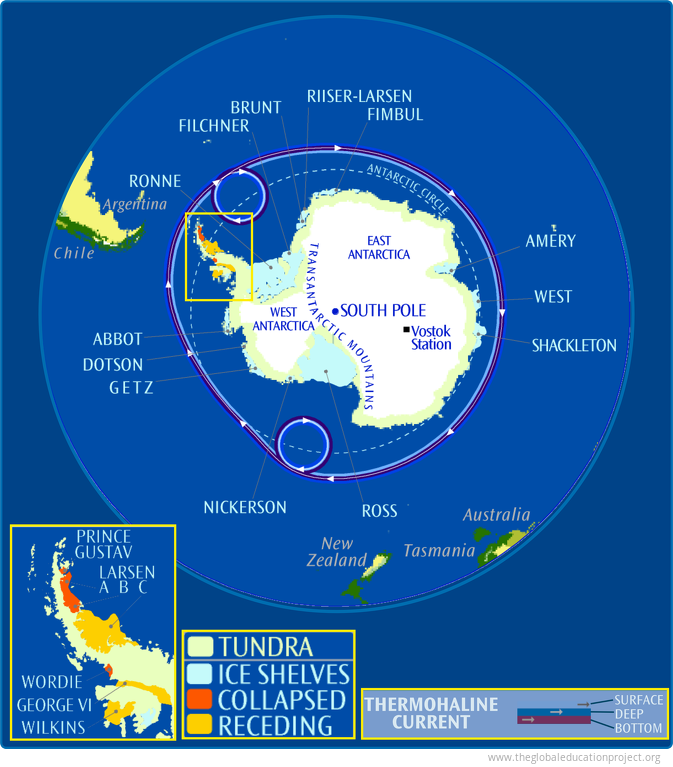
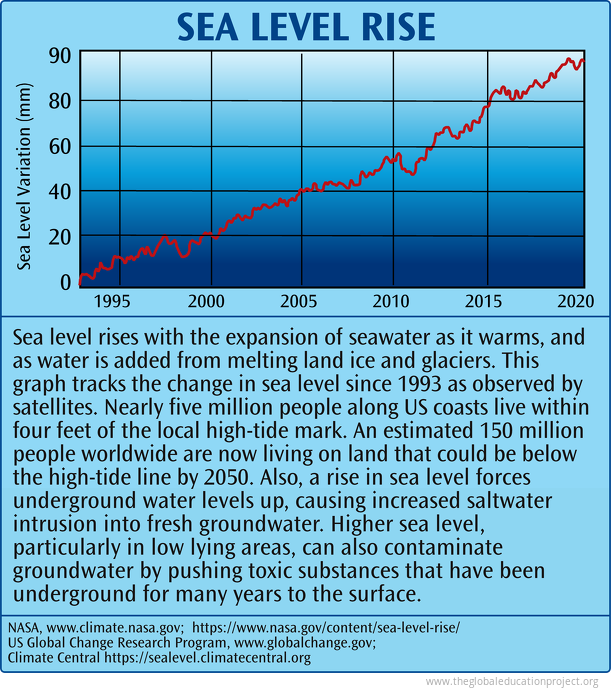
Sea ice and glaciers are melting throughout the globe from warmer temperatures. Over 60% of the world's fresh water is stored in the ice sheets covering Antarctica—up to 4.5 km thick and up to 25 million years old. The Ross ice shelf alone is as large as France. The average temperature on the Antarctic Peninsula has risen 4.5 degrees F since 1947. All of the major floating ice shelves are shrinking—melting more during the summer than is being refrozen during winter. About 8,000 sq. km have been lost since the 1950s. Were the West Antarctic ice sheet to melt due to climate warming, it could raise sea levels by 20 ft. Sea levels are already rising by 2mm a year—faster than during the past 5,000 years.Krill—small shrimplike sea creatures that are a major food source for seals, whales and penguins—feed on algae found on sea ice. In Antarctica, they are concentrated northeast of the Antarctic Peninsula, but have declined 80% since the 1970s.
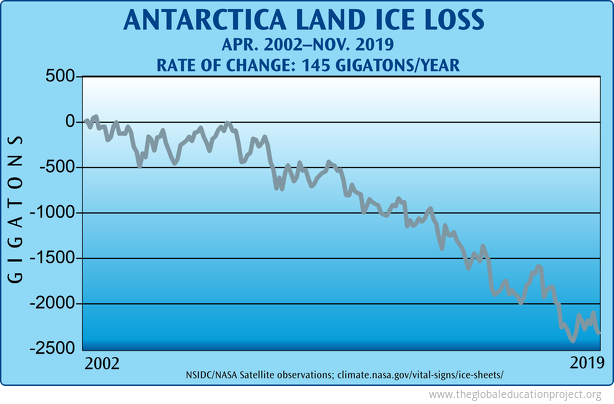
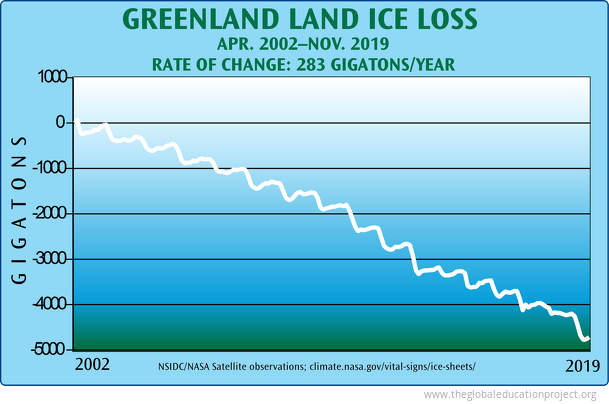
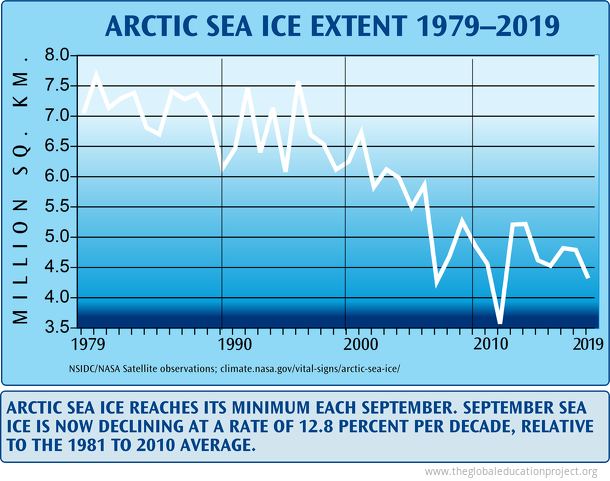 Satellite based records of Arctic sea ice began in 1978. By late October of 2020, the main nursery of Arctic sea ice in Siberia had yet to start freezing. The late freeze could amplify feedbacks that cause more decline of sea ice. Less sea ice means less of a white area to reflect the sun’s heat back into space. When ice forms late in Siberia, it could be thinner and more likely to melt sooner as it drifts westward. This could mean fewer nutrients for Arctic plankton, which will then have a reduced capacity to draw down carbon dioxide from the atmosphere.
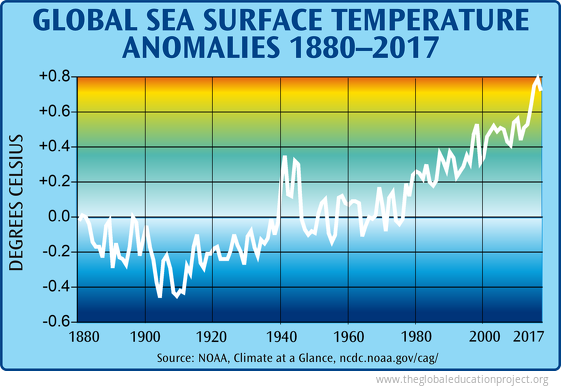 The ocean—the major heat, carbon and water reservoir of the world—is a crucial regulator of the Earth's climate. More than 93% of the enhanced atmospheric heating since the 1970s has been absorbed by the ocean, even affecting the deep ocean. The absorption of a disproportionate amount of heat from global warming and of the rapidly increasing emissions of carbon dioxide—which raises the levels of ocean acidity—has significant consequences for humanity, marine species and the ecosystems of the ocean.
Sources
Greenhouse Gases Text:
IUCN: Species Susceptibility to Climate Change Impacts; iucn.org/download /climatic_change_chapter_en_final.pdf;
IPCC (Intergovernmental Panel on Climate Change): "Climate Change 2014; Impacts, Adaptation, and Vulnerability"; IPPC 2014-WG2AR5_SPM_FINAL.pdf;
IPCC: "Climate Change 2013; The Physical Basis",IPCC_2013_WGIAR5_SPM_brochure_en.pdf
NASA: Climate Change: Vital Signs of the Planet; climate.nasa.gov/vital-signs
US EPA: "Climate Impacts on Ecosystems"; epa.gov/climate-impacts/climate-impacts-ecosystems
NOAA: "Climate"; noaa.gov/climate
US EPA: Climate Change Science; epa.gov/climatechange
Canadia OPR: List of Worldwide Scientific Organizations, opr.ca.gov/s_listoforganizations.php
Historical Temperature and Major Greenhouse Gasses Chart:
Vostok Ice Core Data for 420,000 Years, IGBP PAGES/World Data Center for Paleoclimatology, Petit, J.R., et al., 2001, Data Contribution Series #2001-076
NOAA/NGDC Paleoclimatology Program, Boulder CO, USA, www.ngdc.noaa.gov/paleo/icgate.html
The Intergovernmental Panel on Climate Change (IPCC),Climate Change 2001: Working Group I: The Scientific Basis, www.grida.no/climate/ipcc_tar/wg1/221.htm
Wikipedia,en.wikipedia.org/wiki/Ice_age; The 2Degree institute: CO2 levels; https://www.co2levels.org/; https://www.methanelevels.org/
CO2 PPM: NASA: Global Climate Change, Vital Signs of the Planet; climate.nasa.gov/vital-signs/carbon-dioxide/
Atmospheric CO2 Concentrations Chart:
NOAA, "Atmospheric CO2 1958-2019",
ftp://aftp.cmdl.noaa.gov/products/trends/co2/co2_mm_mlo.txt;
NASA, climate.nasa.gov
CO2 Emissions 1751–2017 Chart:
Global Carbon Project; Carbon Dioxide Information Analysis Centre; cited at: www.ourworldindata.org/grapher/cumulative-co-emissions
Top Emitters of CO2 Chart:
Global Carbon Project, Carbon Dioxide Information Analysis Centre; www.ourworldindata.org
Carbon Disclosure Project, The Carbon Majors Database, CDP Carbon Majors Report 2017; www.cdp.net
World Cumulative CO2 Emissions Chart:
Global Carbon Project, Carbon Dioxide Information Analysis Centre; www.ourworldindata.org/grapher/cumulative-co-emissions
Methane Text:
US EPA: Methane, Sources and Emissions; www.energybc.ca/cache/naturalgas; www.epa.gov/methane/sources.html
US Department of Energy; "Methane Hydrate", https://energy.gov/fe/science-innovation/oil-gas-research/methane-hydrate
NASA; https://earthobservatory.nasa.gov/features/MethaneMatters
Global Temperature Anomalies Chart:
NASA, World of Change: Global Temperatures; earthobservatory.nasa.gov/world-of-change/global-temperatures
NASA/GISS Goddard Institute for Space Studies, www.giss.nasa.gov
Solar Energy Text:
Global Dimming, http://news.bbc.co.uk/2/hi/science/nature/4171591.stm; en.wikipedia.org/wiki/Global_dimming
Union of Concerned Scientists,"Does air pollution—specifically tiny atmospheric particles (aerosols)—affect global warming?", updated Aug 23, 2016; www.ucsusa.org/resources/does-air-pollution-affect-global-warming
Sea Ice and Glaciers Text:
British Antarctic Survey, www.antarctica.ac.uk/Key_Topics/IceSheet_SeaLevel/ice_shelf_loss.html
Antarctic and Southern Ocean Coalition, “Ice Shelves”, www.asoc.org/general/iceshelve.htm
British Antarctic Survey, www.antarctica.ac.uk/Key_Topics/IceSheet_SeaLevel/index.html
British Antarctic Survey, www.antarctica.ac.uk/News_and_Information/Press_Releases/
Antarctic Geography, Ice, and Currents Map:
"Antarctic Region"; Perry Castaneda Map Library, www.lib.utexas.edu/maps/
National Snow and Ice Data Center, http://nsidc.org; National Geographic Maps, "Antarctica", Feb. 2002
Antarctica Ice Loss Chart:
NSID/NASA Satellite observations; climate.nasa.gov/vital-signs/ice-sheets/
Greenland Land Ice Loss Chart:
NSIDC/NASA Satellite observations; climate.nasa.gov/vital-signs/ice-sheets/
Arctic Sea Ice Extent Chart:
NSIDC/NASA Satellite observations; climate.nasa.gov/vital-signs/arctic-sea-ice/
NOAA; https://psl.noaa.gov/forecasts/seaice/
Global Sea Surface Temperature Chart:
IUCN: Ocean warming: causes, scale, effects and consequences https://portals.iucn.org/library/sites/library/files/documents/2016-046-Summ.pdf
Sea Level Rise Chart:
NASA, www.climate.nasa.gov; https://www.nasa.gov/content/sea-level-rise/
US Global Change Research Program, www.globalchange.gov;
Climate Central, https://sealevel.climatecentral.org
Tags: climate change, greenhouse gases, carbon dioxide, methane, sea ice, arctic ice, antarctica ice, greenland ice, ocean warmin, climate
Sign up for EARTH Dispatches
Enter you email below to get jaw dropping charts and maps delivered straight to your inbox.
Get the EARTH presentation
A 150 page high-resolution PDF containing all updated maps, charts and data on EARTH website; use as an information-packed educational slide show, printed booklet or a set of single-page handouts.
Learn More
