Development & Debt
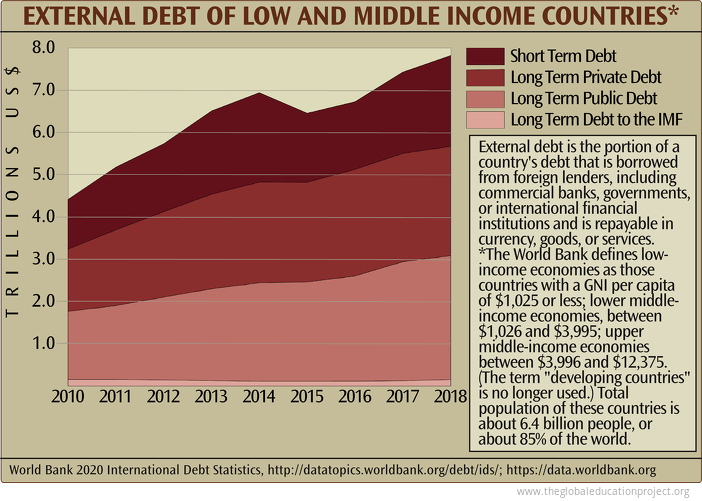
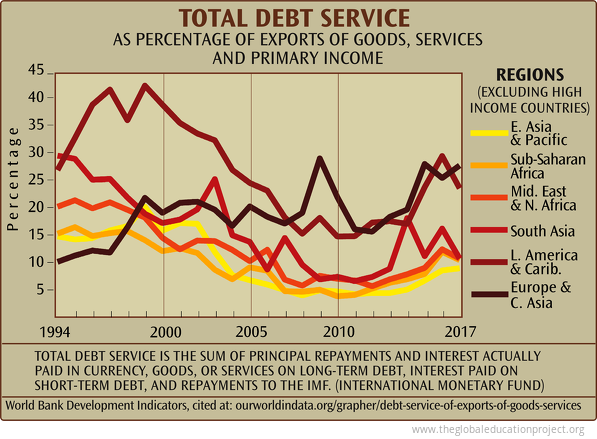
How onerous are the debt burdens of countries? How are the IMF and World Bank helping or hindering sustainable development? Are poor countries catching up to rich ones? Succinct graphs and an overview of the UN's Human Development ranking helps answer these questions.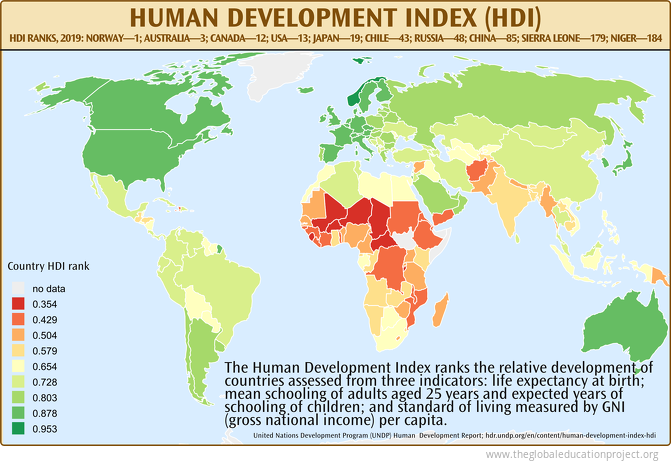 The UN Human Develpment Index (HDI) was designed to measure human development not only by economic advances, but also potential improvements in human well-being. In 2010, the HDI Report introduced an inequality-adjusted Human Development Index (IHDI) which measures the average level of human development of people in a society once inequality is taken into account.
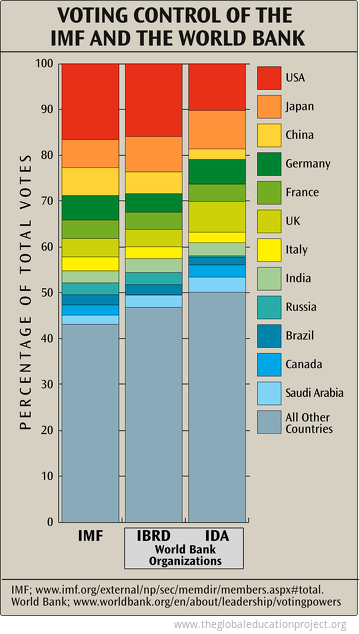 The IMF was formed in 1945 by the UN. Each of the 189 IMF member countries is assigned a quota, or contribution, that reflects the country's relative size in the global economy. Financial contributions from member governments are linked to voting power.
The World Bank (WB) is a shareholder company. more than 80% of the Bank’s assets come from international investors. The bank’s main activity is investment in profit seeking activities—hard core investment supported by vigorous debt service procedures.
Whereas banks and companies can go bankrupt if they invest unwisely, the World Bank and the IMF can pursue their loans in perpetuity, regardless of the loans having been given to dictators or incompetent borrowers, and regardless of whether the money actually benefited the poor.
When lending money, a commercial bank is only required to have financial assets (“money”) equalling a fraction of the amount of its lending. Over 90% of the “money” in use in the United States exists only as records kept by banks and other financial institutions.
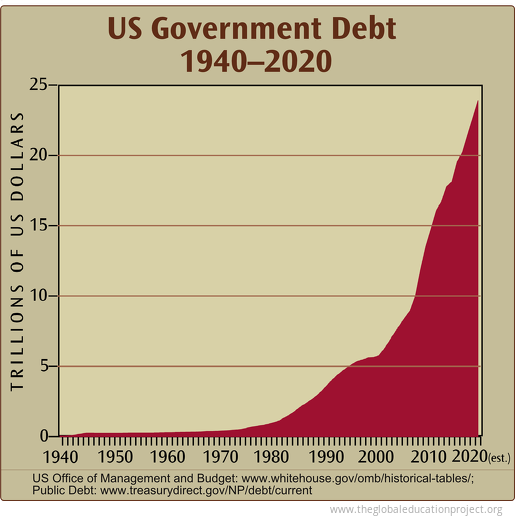 US GOVERNMENT DEBT AND BUDGET DEFICIT
In September 2020 the US federal debt was over $27 trillion, and could reach 118% of GDP by 2030.
In April 2020, the US Congressional Budget Office (CBO), incorporating the effects of the COVID-19 pandemic, posted updated projections that the federal budget deficit for 2020 will total $3.7 trillion—17.9% of GDP. This is a $2.6 trillion increase compared to the March 2020 projection of $1.1 trillion—4.9 % of GDP. The CBO notes that these projections are uncertain, and will change as the pandemic unfolds.
Further projections estimate that the deficit will average a $1.6 trillion increase per year from 2021 through 2030.
In nominal dollars, it is estimated that the debt will grow from nearly $22 trillion in 2020 to over $133 trillion by 2051—202% of GDP.
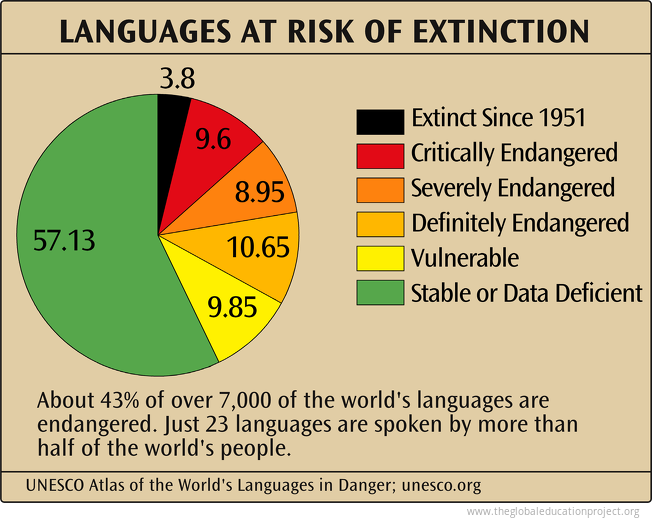 About 43% of over 7,000 of the world's languages are endangered. Just 23 languages are spoken by more than half of the world's people, inhabiting upwards of 85% of the land surface of the globe. [1] These same languages are of the cultures primarily responsible for the current global extinction crisis. [2] The extinction rate of languages, and often the people who speak them, is astounding. Up to 95% of languages may be extinct within 100 years. [3]
 Language and cultural diversity is often matched by regional biodiversity—suggesting that both language and nature are a single system of diversity. “First World” societies are replacing ancient linguistic cultural diversity with vast “mono-languages.”
Sources
The Human Development Index Map:
United Nations Development Program (UNDP) Human Development Report; hdr.undp.org/en/content/human-development-index-hdi
Voting Control of the IMF and World Bank Chart:
IMF; www.imf.org/external/np/sec/memdir/members.aspx#total
World Bank; www.worldbank.org/en/about/leadership/votingpowers
External Debt of Low and Middle Income Countries Chart:
World Bank 2020 International Debt Statistics, http://datatopics.worldbank.org/debt/ids/; https://data.worldbank.org
Total Debt Service Chart:
World Bank Development Indicators, cited at: ourworldindata.org/grapher/debt-service-of-exports-of-goods-services
US Government Debt Chart:
Congressional Budget Office; www.cbo.gov
Committee for a Responsible Federal Budget; www.crfb.org/blogs/cbo-updates-budget-projections-wake-covid-19; www.crfb.org/papers/analysis-cbos-march-2021-long-term-budget-outlook
US Office of Management and Budget: www.whitehouse.gov/omb/historical-tables/
Public Debt: www.treasurydirect.gov/NP/debt/current
Foreign Direct Investment Chart:
World Bank; https://data.worldbank.org/indicator
Languages at Risk of Extinction Chart:
[1] UNESCO Atlas of the World's Languages in Danger; unesco.org
[2] "A House on Fire: Connecting the Biological and Linguistic Diversity Crises”, K. Suckling, www.animana.org/tab2/23suckling-ahouseonfire.shtml
[3] “The Conservation of Endangered Languages”, Univ. of Bristol, www.bris.ac.uk/Depts/Philosophy/CTLL/report.txt
Tags: development & debt
Sign up for EARTH Dispatches
Enter you email below to get jaw dropping charts and maps delivered straight to your inbox.
Get the EARTH presentation
A 150 page high-resolution PDF containing all updated maps, charts and data on EARTH website; use as an information-packed educational slide show, printed booklet or a set of single-page handouts.
Learn More
