Chart of US Government Debt
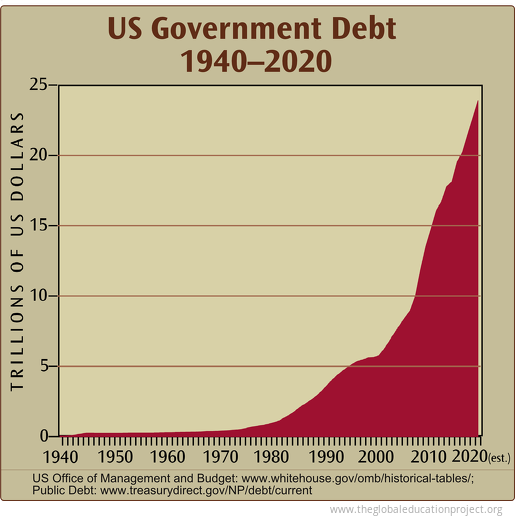
US GOVERNMENT DEBT AND BUDGET DEFICIT
In September 2020 the US federal debt was over $27 trillion, and could reach 118% of GDP by 2030.
In April 2020, the US Congressional Budget Office (CBO), incorporating the effects of the COVID-19 pandemic, posted updated projections that the federal budget deficit for 2020 will total $3.7 trillion—17.9% of GDP. This is a $2.6 trillion increase compared to the March 2020 projection of $1.1 trillion—4.9 % of GDP. The CBO notes that these projections are uncertain, and will change as the pandemic unfolds.
Further projections estimate that the deficit will average a $1.6 trillion increase per year from 2021 through 2030.
In nominal dollars, it is estimated that the debt will grow from nearly $22 trillion in 2020 to over $133 trillion by 2051—202% of GDP.
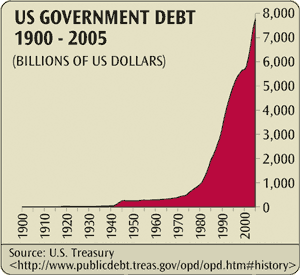
2005 version of this chart
Sources
Committee for a Responsible Federal Budget; www.crfb.org/blogs/cbo-updates-budget-projections-wake-covid-19; www.crfb.org/papers/analysis-cbos-march-2021-long-term-budget-outlook
US Office of Management and Budget: www.whitehouse.gov/omb/historical-tables/
Public Debt: www.treasurydirect.gov/NP/debt/current
Tags: economics, national debt of the united states, government debt, historical us government debt, us federal deficit, us government debt, development
Sign up for EARTH Dispatches
Enter you email below to get jaw dropping charts and maps delivered straight to your inbox.
Get the EARTH presentation
A 150 page high-resolution PDF containing all updated maps, charts and data on EARTH website; use as an information-packed educational slide show, printed booklet or a set of single-page handouts.
Learn More
