Agriculture & Food
Agricultural and food production has changed dramatically in the past 100 years as increasing population and consumption put pressure on the world's food supply. A look at the environmental impacts of agriculture and food; global distribution and nutrition; food loss and waste.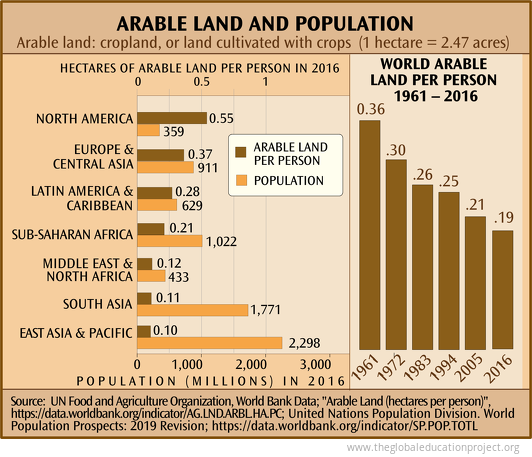 "In 1960, when the world population numbered only 3 billion, approximately 0.5 hectare of cropland per capita was available, the minimum area considered essential for the production of a diverse, healthy, nutritious diet of plant and animal products like that enjoyed widely in the United States and Europe." — "Soil as an Endangered Ecosystem", David Pimental
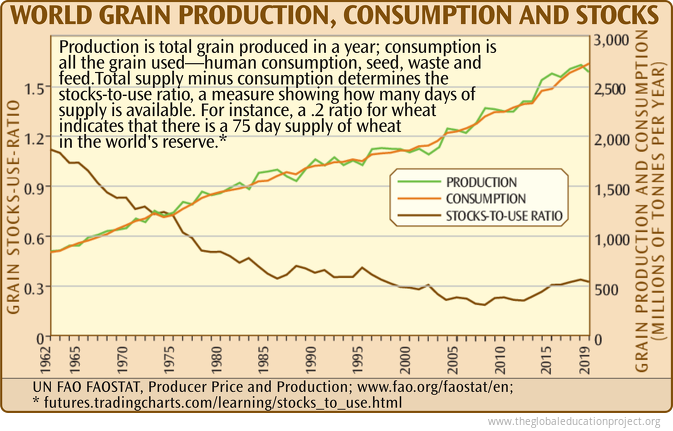 Increases in grain production brought about by irrigation and synthetic fertilizer and pesticide inputs have peaked and begun declining. As consumption surpasses production, the world's stocks of stored grain have been falling relative to each year's use. When supply can no longer meet demand, free market price competition may starve the poor.
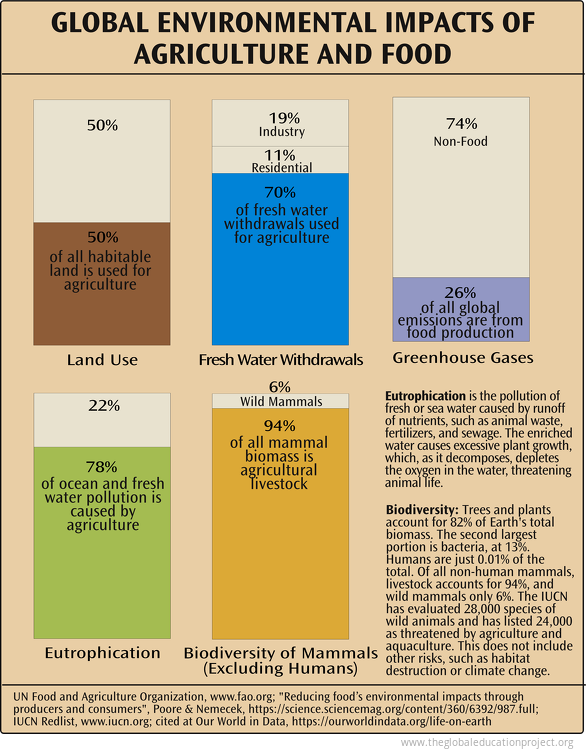
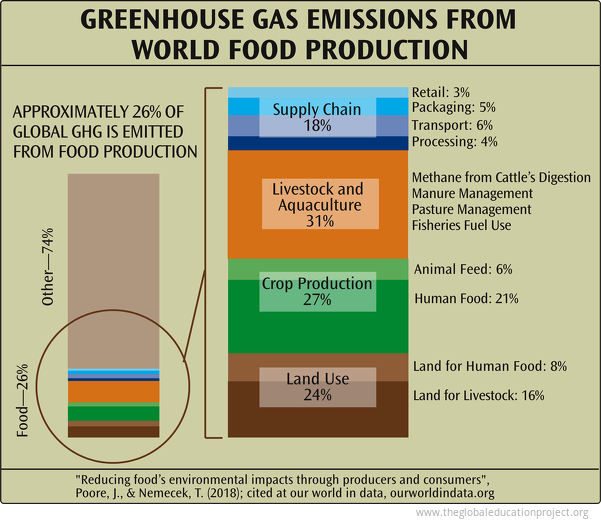
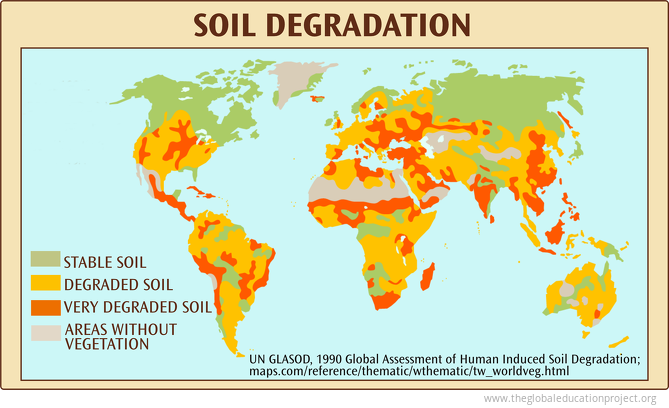 An estimated 75% of the Earth’s land surface has been degraded through human activities, negatively impacting the well-being of at least 3.2 billion people, pushing the planet towards a sixth mass species extinction, and costing more than 10% of the annual global gross product in loss of biodiversity and ecosystem services.
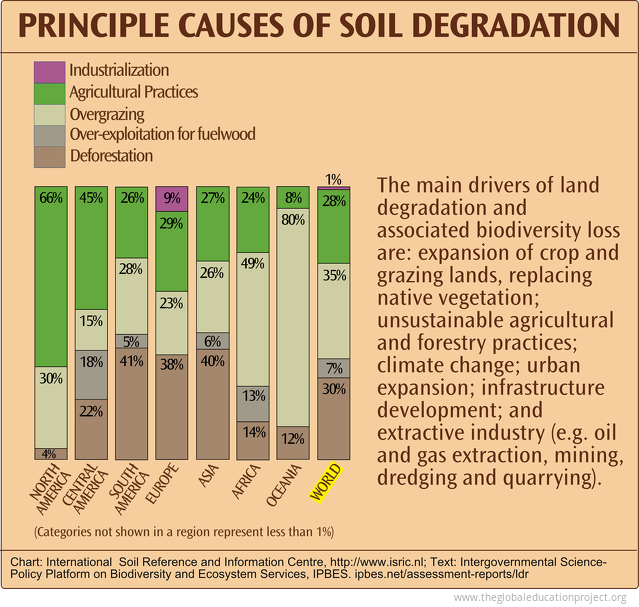 "About 2 million hectares of rainfed and irrigated agricultural lands are lost to production every year due to severe land degradation, among other factors." [1]
"It takes approximately 500 years to replace 25 millimeters (1 inch) of topsoil lost to erosion. The minimal soil depth for agricultural production is 150 millimeters. From this perspective, productive fertile soil is a nonrenewable, endangered ecosystem." [2]
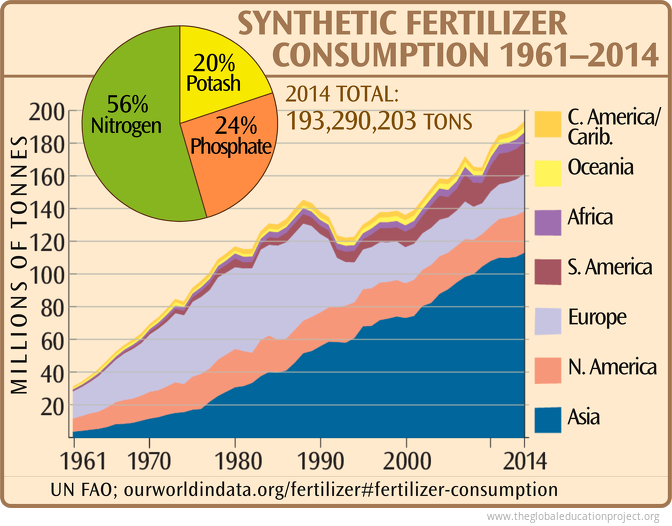 Nitrogen fertilizer production requires a large and affordable supply of natural gas.
Natural gas is a key feedstock (up to 90 percent of the total costs) in the manufacturing of nitrogen fertilizer for which there is no practical substitute. Nitrogen fertilizer prices tend to increase when gas prices increase.
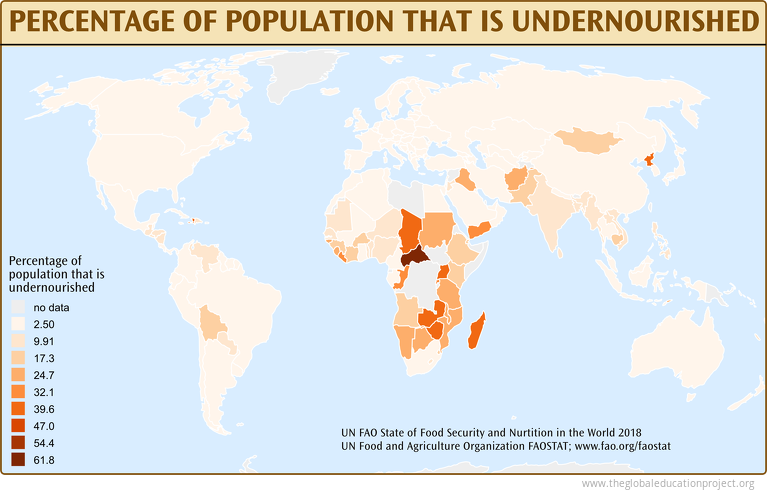 After a prolonged decline, recent estimates show global hunger increased in 2016. The failure to reduce world hunger is closely associated with the increase in conflict and violence in several parts of the world. In addition, gains made in ending hunger and malnutrition are being eroded by climate variability and exposure to more complex, frequent and intense climate extremes.
In 2020, the World Food Programme, the food-assistance branch of the United Nations, was awarded the Nobel Peace Prize for its efforts to provide food assistance in areas of conflict, and to prevent the use of food as a weapon of war and conflict.
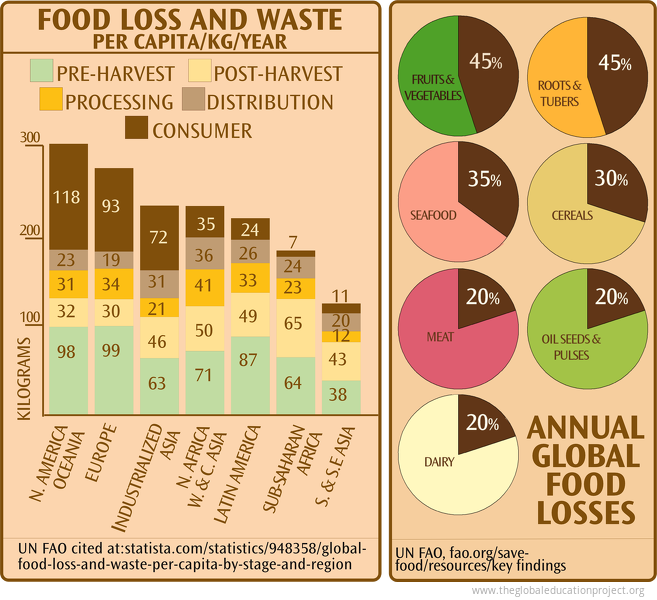 Approximately one third of the food produced in the world for human consumption—nearly 1.3 billion tonnes—gets lost or wasted every year.
"Loss" refers to any food that is lost in the supply chain between the producer and the market from problems at pre-harvest, harvest, handling, storage, packing or transportation. "Waste" refers to the discarding or non food use of food that is safe and nutritious for human consumption. Food that deviates from what is considered optimal in terms of shape, size and colour, or beyond the “best-before” date is often discarded by retailers or consumers.
In Europe and North America, annual waste by consumers is between 95–115 kg/per capita, but only 6–11 kg/per capita in sub-Saharan Africa, S and SE Asia. In developing countries 40% of losses occur at post-harvest and processing levels. In industrialized countries more than 40% of losses happen at retail and consumer levels.
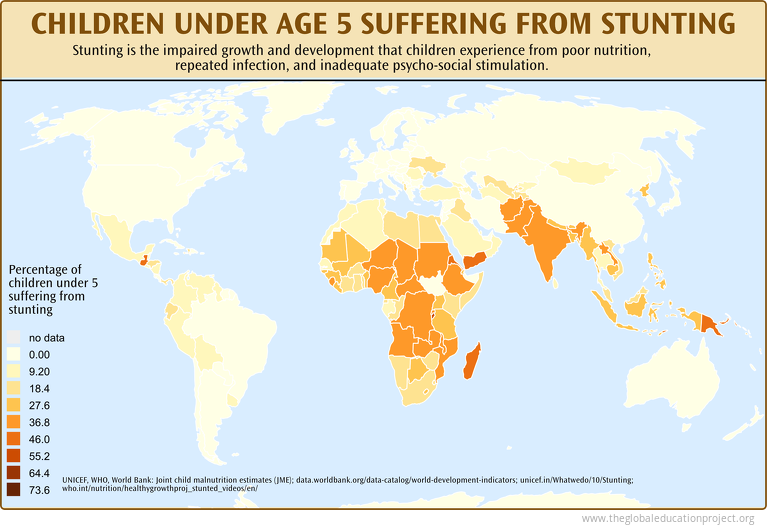 In 2020, nearly 144 million children under 5 suffer from stunting (under height), 47.0 million children under 5 were wasted (underweight) , and of those, 14.3 million were considered severely wasted. Stunting and other forms of under-nutrition are thought to be responsible for nearly half of all child deaths globally. Poor nutrition, poor hygiene, infections, lack of clean water, and lack of healthcare to both the child and the mother are some factors that can contribute to stunting.
 "Severe food insecurity is higher in 2017 than it was in 2014 in every region except Northern America and Europe, with notable increases in Africa and Latin America."
--UN FAO State of Food Security and Nutrition in the World 2018
Sources
Arable Land and Population Chart:
UN Food and Agriculture Organization, World Bank Data; Arable Land (hectares per person), https://data.worldbank.org/indicator/AG.LND.ARBL.HA.PC;
United Nations Population Division. World Population Prospects: 2019 Revision; https://data.worldbank.org/indicator/SP.POP.TOTL;
"Soil as an Endangered Ecosystem", David Pimental, Bioscience; Nov 2000
World Grain Production, Consumption, and Stocks Chart:
UN FAO FAOSTAT, Produce Price and Production; www.fao.org/faostat/en;
*futures.tradingcharts.com/learning/stocks_to_use.html
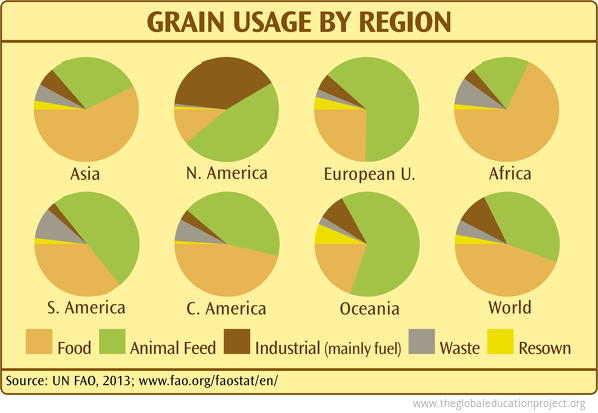
Grain Usage by Region Chart:
UN FAO; www.fao.org/faostat/en
Environmental Impacts of Food Chart:
UN Food and Agriculture Organization, www.fao.org; "Reducing food’s environmental impacts through producers and consumers", Poore & Nemecek, https://science.sciencemag.org/content/360/6392/987.full; *IUCN Redlist, www.iucn.org; cited at Our World in Data, https://ourworldindata.org/life-on-earth
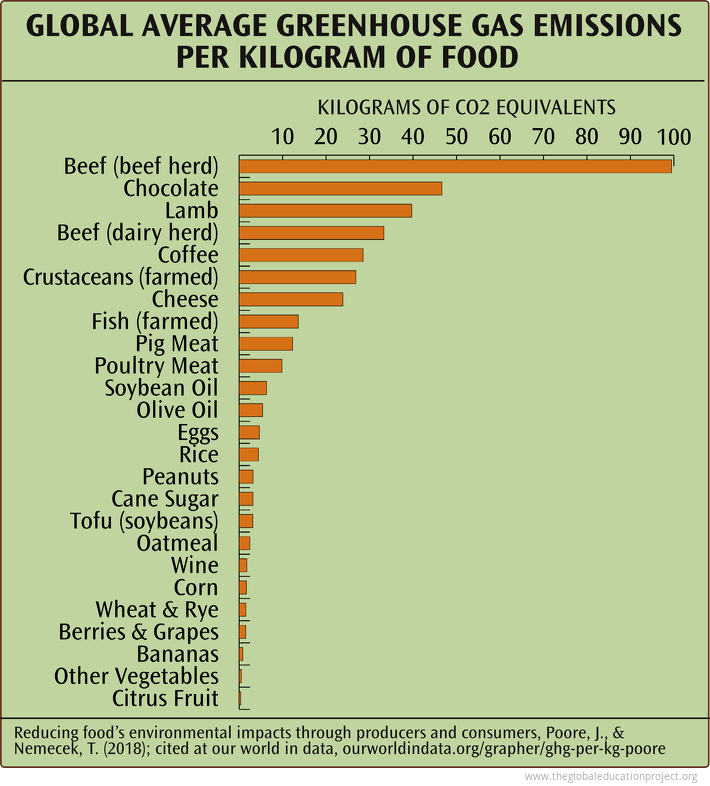
Greenhouse Gas Emissions per Kilogram of Food Chart:
"Reducing food’s environmental impacts through producers and consumers", Poore, J., & Nemecek, T. (2018); cited at our world in data, ourworldindata.org
Soil Degradation in the World Map:
UN GLASOD, Global Assessment of Human Induced Soil Degradation;
Intergovernmental Science-Policy Platform on Biodiversity and Ecosystem Services, IPBES, Mar 2018; ipbes.net/assessment-reports/ldr
Principal Causes of Soil Degradation Chart:
Chart: International Soil Reference and Information Center www.isric.nl
1. World Bank: "Land Resources Management", lnweb18.worldbank.org/ESSD/ardext.nsf/ 11ByDocName/
2. "Soil as an Endangered Ecosystem", David Pimental, Bioscience; Nov 2000; "Population Growth and the Environment: Planetary Stewardship", Pimental, Dec 98, http://egj.lib.uidaho.edu/egj09/piment1.html
World Fertilizer Consumption by Region Chart:
UN FAO; ourworldindata.org/fertilizer#fertilizer-consumption; The Fertilizer Institute, www.tfi.org/Statistics/index.asp; US GAO report: "Natural Gas: Domestic Nitrogen Fertilizer Production Depends on Natural Gas Availability and Prices"
www.gao.gov/new.items/d031148.pdf;
Percentage of the Population that is Undernourished Map:
UN FAO State of Food Security and Nurtition in the World 2018
UN Food and Agriculture Organization FAOSTAT; www.fao.org/faostat
Food Loss and Waste Chart:
UN FAO cited at:statista.com/statistics/948358/global-food-loss-and-waste-per-capita-by-stage-and-region
UN FAO, fao.org/save-food/resources/key findings
UN FAO; Global Food Losses and Food Waste, fao.org/3/mb060e/mb060e00.pdf
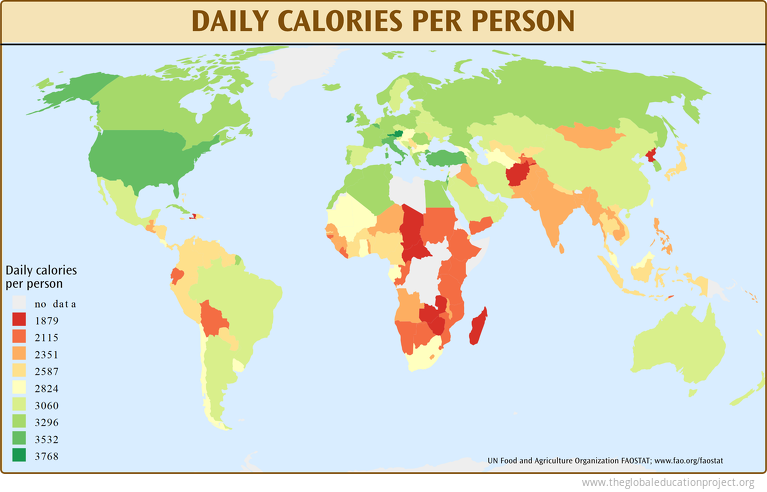
Daily Calories per Person Map:
UN Food and Agriculture Organization FAOSTAT; www.fao.org/faostat
Children Under the Age of Five Suffering From Stunting Map:
UNICEF, WHO, World Bank: Joint child malnutrition estimates (JME); data.worldbank.org/data-catalog/world-development-indicators; unicef.in/Whatwedo/10/Stunting; who.int/nutrition/healthygrowthproj_stunted_videos/en/
Text: UN FAO State of Food Security and Nurtition in the World 2018
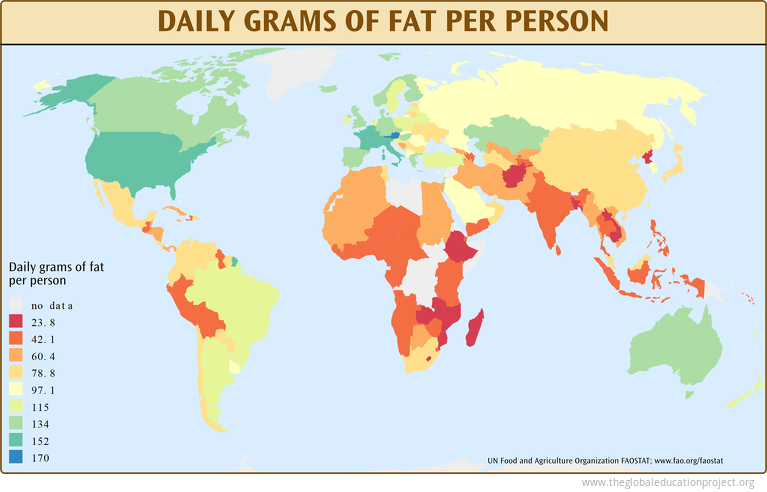
Daily Grams of Fat Map:
UN Food and Agriculture Organization FAOSTAT, www.fao.org/faostat
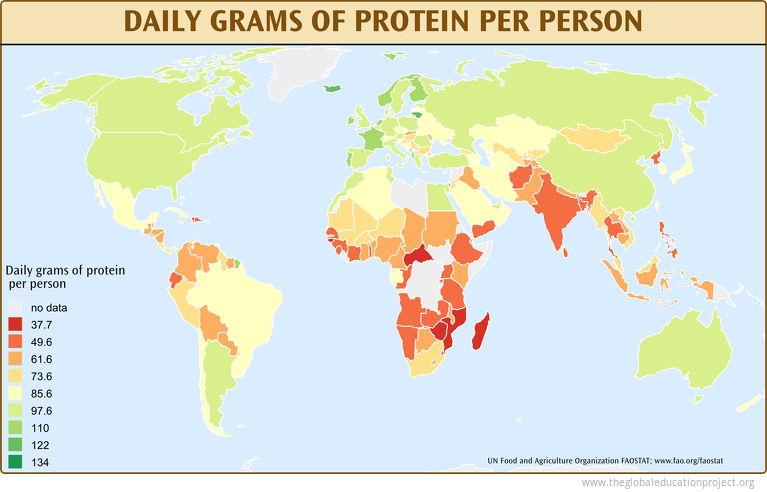
Daily Grams of Protein Map:
UN Food and Agriculture Organization FAOSTAT, www.fao.org/faostat
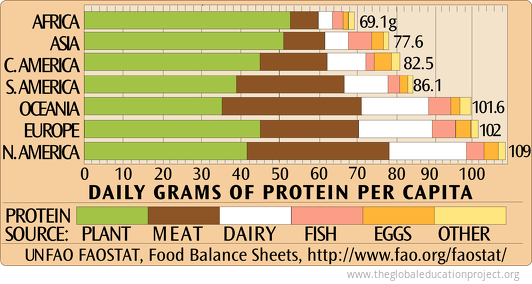
Protein Sources by Region Chart:
UN FAOSTAT, Food Balance Sheets, www.fao,org/faostat/
Tags: arable land, grain, fertilizer, pesticides, soil degradation, biotech, glyphosate, agriculture & food
Sign up for EARTH Dispatches
Enter you email below to get jaw dropping charts and maps delivered straight to your inbox.
Get the EARTH presentation
A 150 page high-resolution PDF containing all updated maps, charts and data on EARTH website; use as an information-packed educational slide show, printed booklet or a set of single-page handouts.
Learn More
