Plastics
This section is an overview of the steep and rapid rise in the production and use of plastics; plastic waste management and mis-management; recycling; and the prevalence of microplastic debris in the environment.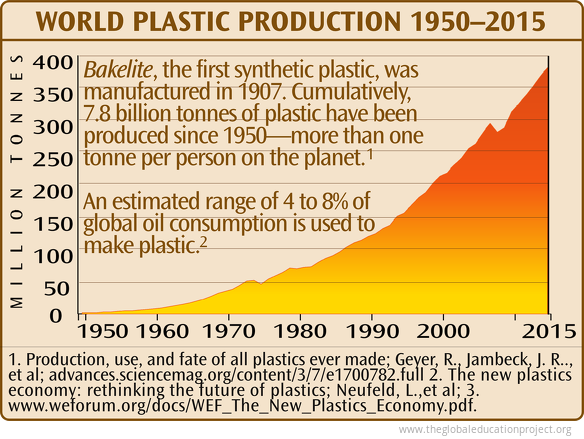 Over 90% of plastics produced are derived from virgin fossil feedstocks—accounting for about 6% of global oil consumption. This is equivalent to the total oil consumption of the global aviation sector.
 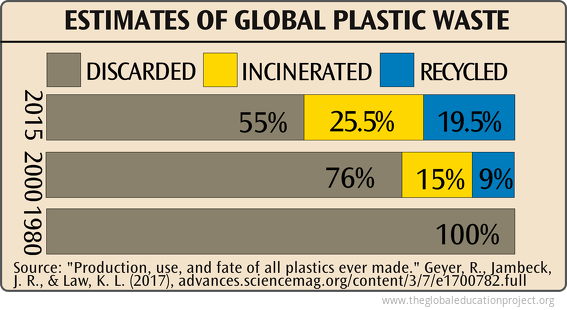 "Recycling delays, rather than avoids, final disposal. It reduces future plastic waste generation only if it displaces primary plastic production; however, this displacement is extremely difficult to establish.
 "Second, plastics can be destroyed thermally. The environmental and health impacts of waste incinerators strongly depend on emission control technology, as well as incinerator design and operation.
"Finally, plastics can be discarded and either contained in a managed system, such as sanitary landfills, or left uncontained in open dumps or in the natural environment." [1]
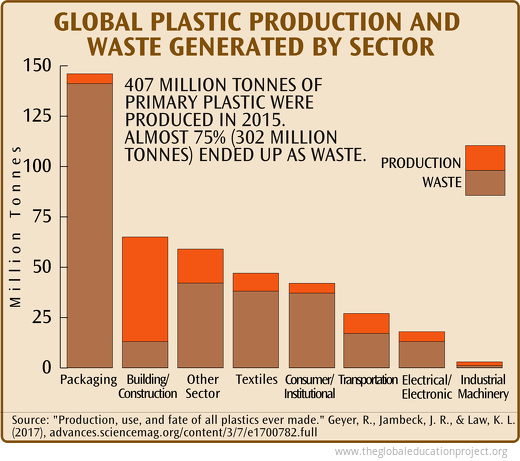 Packaging represents 26% of the total volume of plastics used. Even when managed adequately, the process of recycling plastic ultimately produces a lower quality product and the required shipping, washing, chopping and melting also has a detrimental environmental impact.
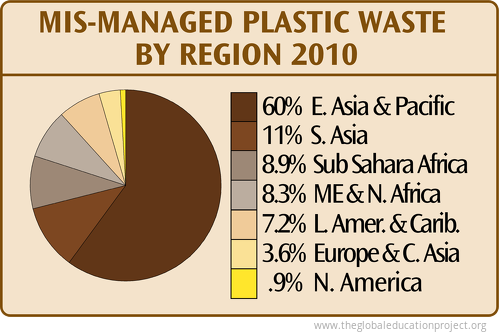 The amount of plastic debris that ends up in the oceans from the land is mostly determined by population size living within 50km of a coast and by the amount of plastic waste that is mismanaged—either littered or disposed into uncontained dumps or landfills.
 A 2020 study shows that in "2016, the United States generated the largest amount of plastic waste of any country in the world (42.0 Mt). Between 0.14 and 0.41 Mt of this waste was illegally dumped in the United States, and 0.15 to 0.99 Mt was inadequately managed in countries that imported materials collected in the United States for recycling. Accounting for these contributions, the amount of plastic waste generated in the United States estimated to enter the coastal environment in 2016 was up to five times larger than that estimated for 2010, rendering the United States' contribution among the highest in the world."
Plastic Recycling
Overall, only about 9% of the 8.3 billion tons of plastic produced since 1950 has ever been recycled and reprocessed into useful product.Developed economies have recycling rates around 30%. Developing economies with a minimal industrial base have recycling rates close to 0%.
Plastic recovery facilities that are responsible for sorting and processing plastics are limited in their economic viability. Each time plastic is recycled, new plastic material must be added and the same piece of plastic can only be recycled 2 or 3 times before the quality decreases and it can no longer be used. In some western municipalities, plastic is now more likely to be stockpiled, incinerated or end up in landfills.
Until 2018, most plastic put in recycling bins in North America, Europe and Australia, some of which is not clean or of a type that can actually be recycled, was exported to China for processing until China enacted a near-total ban on "contaminated garbage"—almost all plastics and paper.
Western countries continue to export tons of waste to Turkey, Thailand, Indonesia, Vietnam and other countries with high rates of waste mis-management, endangering both the low paid workers and the environment.
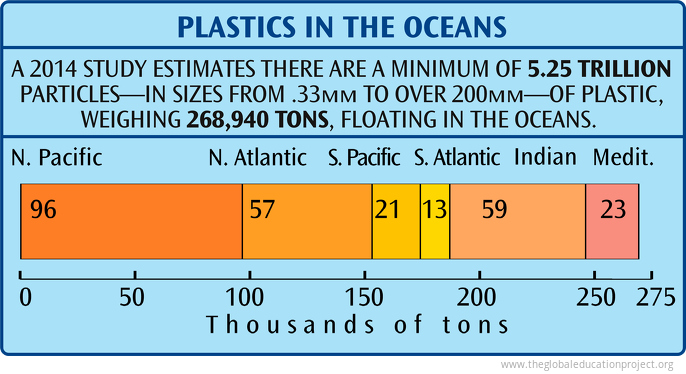 Rivers are a major pathway for plastic transport into the seas. Ten rivers: the Yangtze, Indus, Yellow, Hai He, Ganges, Pearl, Amur and Mekong in Asia; and the Nile and the Niger in Africa contribute about 90% of all river-driven plastics into the sea.
Microplastics in the Environment
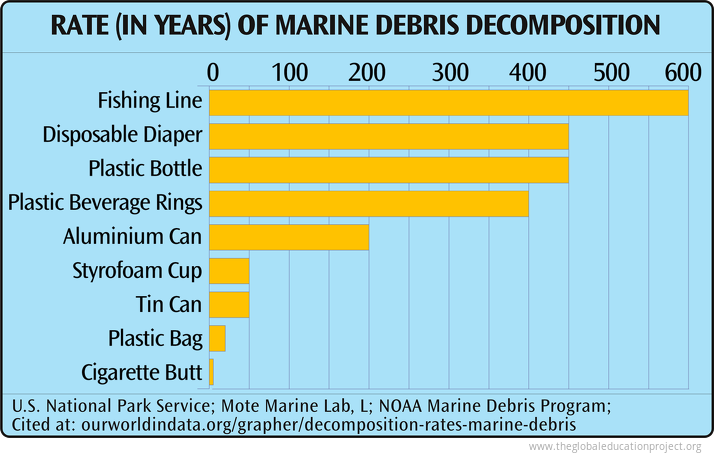
Plastic does not completely disappear from the environment. As plastic degrades, it shreds into “microplastics”—small fibres that range in size from 5 millimetres to less than a third of a millimetre. These microplastics have been found everywhere researchers have looked: in the organs of marine creatures, in salt, honey, beer, dust, soil, bottled water, tap water, rainwater, Arctic and Antarctic sea ice, deep ocean sediment, on top of Swiss mountains, and in human feces. Microplastics enter the human body from food, fibres coming off of plastic bottles or packaging, and from cosmetics or toothpaste.Microplastics in the ocean can be ingested by zooplankton and then transferred up the food chain, ultimately to humans. Toxic chemicals released from fragmented plastic also severely impact the biological function of marine organisms.
In June 2020, a study of ocean water samples shows that only 8% of the fibers in the samples were microplastics, and that more than 90% were plant or animal-based materials: cotton, wool and other celluloses, such as linen and flax. However, the effects of microfiber ingestion on marine organisms are as yet poorly understood—whether they are natural or synthetic in origin.
Sources
World Plastic Production Chart:
Production, use, and fate of all plastics ever made; Geyer, R., Jambeck, J. R., et al; advances.sciencemag.org/content/3/7/e1700782.full
The new plastics economy: rethinking the future of plastics; Neufeld, L.,et al; www.weforum.org/docs/WEF_The_New_Plastics_Economy.pdf.
Estimates of Global Plastic Waste Chart:
"Production, use, and fate of all plastics ever made"' Geyer, R., Jambeck, J. R., & Law, K. L. (2017); advances.sciencemag.org/content/3/7/e1700782.full
Global Plastic Production and Waste Chart:
Production, use, and fate of all plastics ever made, Geyer, R., Jambeck, J. R., & Law, K. L. (2017), advances.sciencemag.org/content/3/7/e1700782.full
Mismanaged Plastic Waste Chart:
Plastic Waste Inputs from Land into the Ocean, 2015; Jambeck, J. R., Geyer, R., et. al; science.sciencemag.org/content/347/6223/768
"The United States Contribution of Plastic Waste to Land and Ocean", October 2020, Law, Kara, et. al; www.science.org/doi/10.1126/sciadv.abd0288
Plastic Recycling Text:
Plastics recycling worldwide: current overview and desirable changes, Woldemar d’Ambrières; journals.openedition.org/factsreports/5102
The Chinese import ban and its impact on globalplastic waste trade; https://advances.sciencemag.org/content/advances/4/6/eaat0131.full.pdf
Plastics in the Ocean Chart:
"Estimation of global plastic loads delivered by rivers into the sea", 2017, Schmidt, et. al; Helmholtz Centre for Environmental Research; www.ufz.de/export/data/2/149396_EGU_2017_Schmidt.pd
Marine Debris Decomposition Chart:
U.S. National Park Service; Mote Marine Lab, L; NOAA Marine Debris Program; cited at: ourworldindata.org/grapher/decomposition-rates-marine-debris
Microplastics in the Environment Text:
Deep-sea Debris Database of 30-yr observation records was launched in 2017; Marine Policy Volume 96, October 2018, www.sciencedirect.com/science/article/pii/S0308597X17305195
Tags: plastics
Sign up for EARTH Dispatches
Enter you email below to get jaw dropping charts and maps delivered straight to your inbox.
Get the EARTH presentation
A 150 page high-resolution PDF containing all updated maps, charts and data on EARTH website; use as an information-packed educational slide show, printed booklet or a set of single-page handouts.
Learn More
