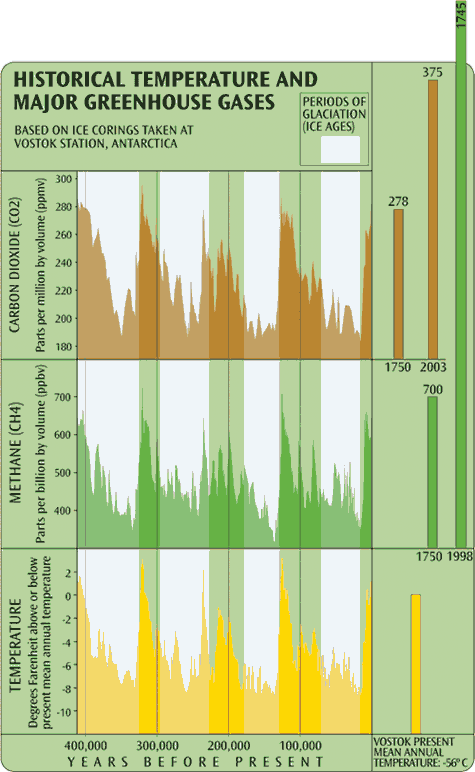
Chart of Historical Temperature and Major Greenhouse Gasses
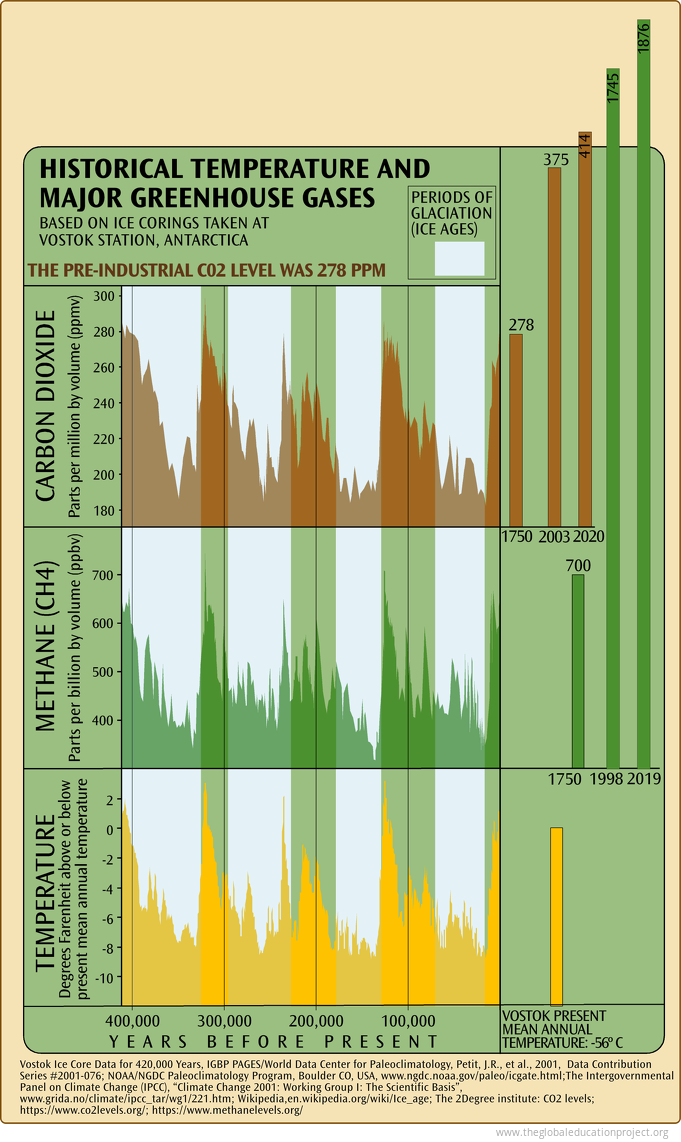
CO2 concentrations are well above historic maximum levels.* The GWP (Global Warming Potential) of methane gas (CH4) is greater than the GWP of CO2. Warming could release vast quantities of CH4 from thawing tundra and seabed methane hydrates.
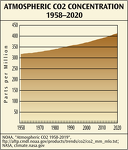
*Levels of CO2 continue to increase, measuring 415.25 PPM in January, 2021
2005 version of this chart
Sources
NOAA/NGDC Paleoclimatology Program, Boulder CO, USA, www.ngdc.noaa.gov/paleo/icgate.html
The Intergovernmental Panel on Climate Change (IPCC),Climate Change 2001: Working Group I: The Scientific Basis, www.grida.no/climate/ipcc_tar/wg1/221.htm
Wikipedia,en.wikipedia.org/wiki/Ice_age; The 2Degree institute: CO2 levels; https://www.co2levels.org/; https://www.methanelevels.org/
CO2 PPM: NASA: Global Climate Change, Vital Signs of the Planet; climate.nasa.gov/vital-signs/carbon-dioxide/
Tags: greenhouse gases, historic emissions, climate change, carbon dioxide, methane, temperature, global warming, historical temperature and major greenhouse gasses, climate
Sign up for EARTH Dispatches
Enter you email below to get jaw dropping charts and maps delivered straight to your inbox.
Get the EARTH presentation
A 150 page high-resolution PDF containing all updated maps, charts and data on EARTH website; use as an information-packed educational slide show, printed booklet or a set of single-page handouts.
Learn More
