Chart of Global Temperature Anomalies

"Eighteen of the 19 warmest years all have occurred since 2001, with the exception of 1998. The year 2016 ranks as the warmest on record. This research is consistent with similar constructions prepared by the Climatic Research Unit and the National Oceanic and Atmospheric Administration." NASA/GISS
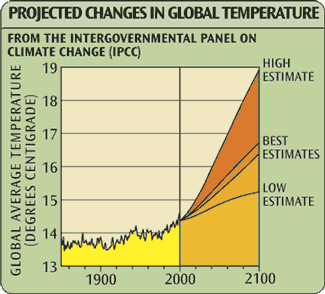
2005 version of this chart
More Climate Infographics


Sources
NASA/GISS Goddard Institute for Space Studies, www.giss.nasa.gov
Tags: temperature change, climate change, global warming, global temperature anomalies, climate
Sign up for EARTH Dispatches
Enter you email below to get jaw dropping charts and maps delivered straight to your inbox.
Get the EARTH presentation
A 150 page high-resolution PDF containing all updated maps, charts and data on EARTH website; use as an information-packed educational slide show, printed booklet or a set of single-page handouts.
Learn More
