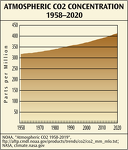
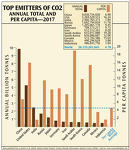
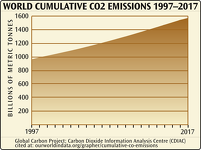
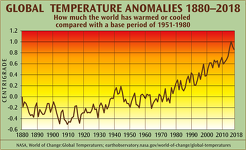
Chart of CO2 Emissions 1751–2017
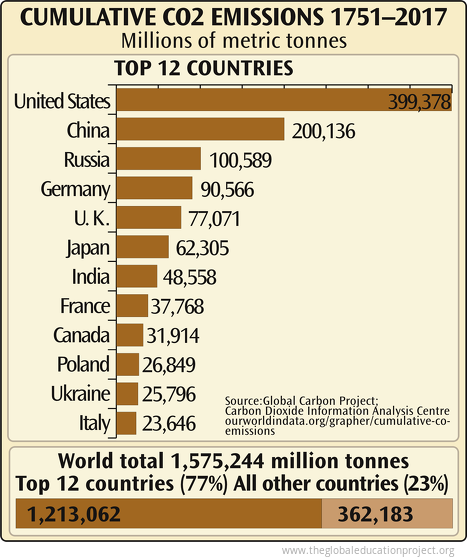
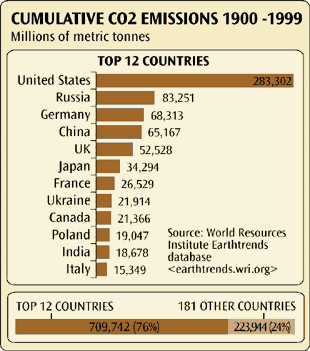
2005 version of this chart
Sources
Tags: carbon dioxide emissions, historic carbon dioxide emissions, climate change, co2 emissions 1751–2017, climate
Sign up for EARTH Dispatches
Enter you email below to get jaw dropping charts and maps delivered straight to your inbox.
Get the EARTH presentation
A 150 page high-resolution PDF containing all updated maps, charts and data on EARTH website; use as an information-packed educational slide show, printed booklet or a set of single-page handouts.
Learn More
