Food
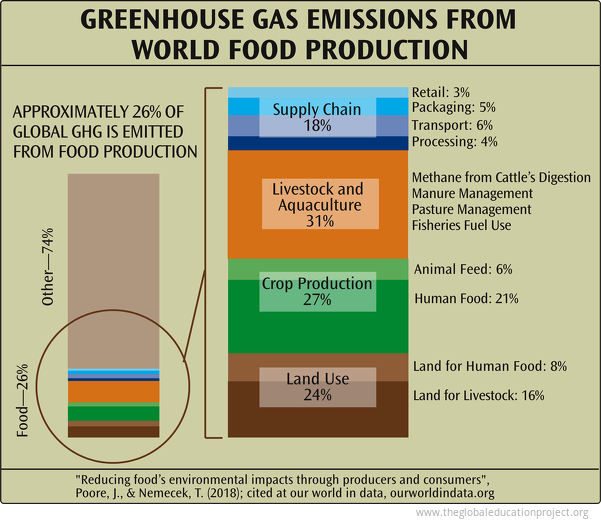
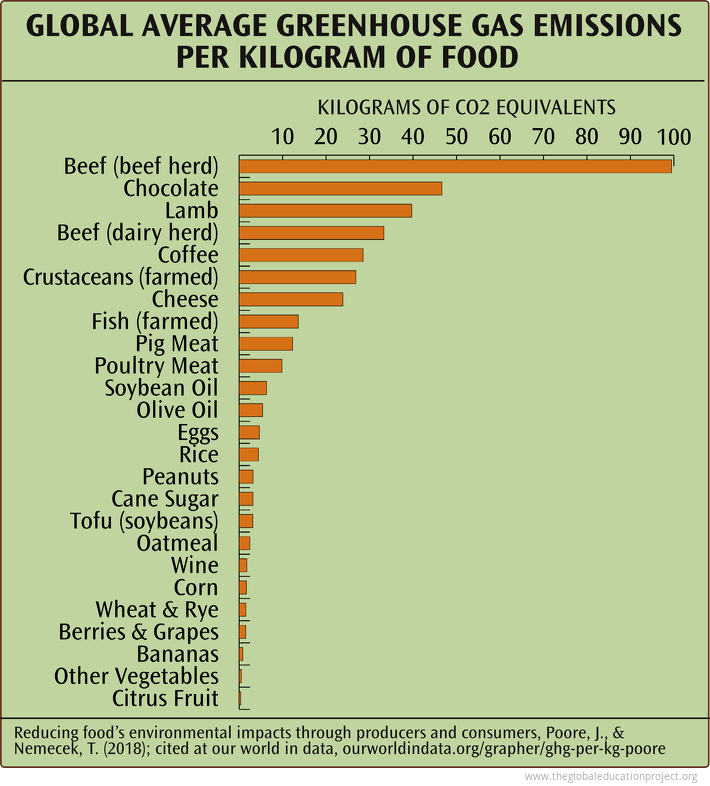
The essential data about food explained in 26 infographics. Detailed charts, maps and tables covering food loss and waste, agriculture & food, greenhouse gas and food production, greenhouse gas emissions per kilogram of food and more. Learn the truth about food and how it relates to the state of the world on The Global Education Project website with un-biased facts from the most reliable sources.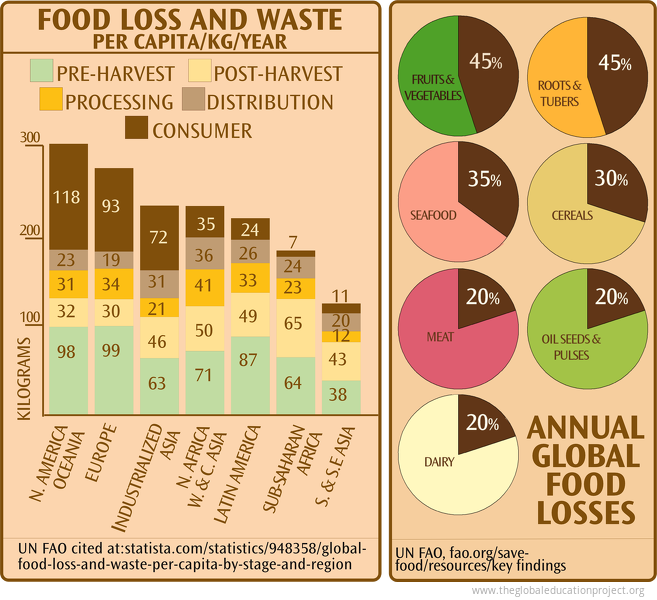 Approximately one third of the food produced in the world for human consumption—nearly 1.3 billion tonnes—gets lost or wasted every year.
"Loss" refers to any food that is lost in the supply chain between the producer and the market from problems...
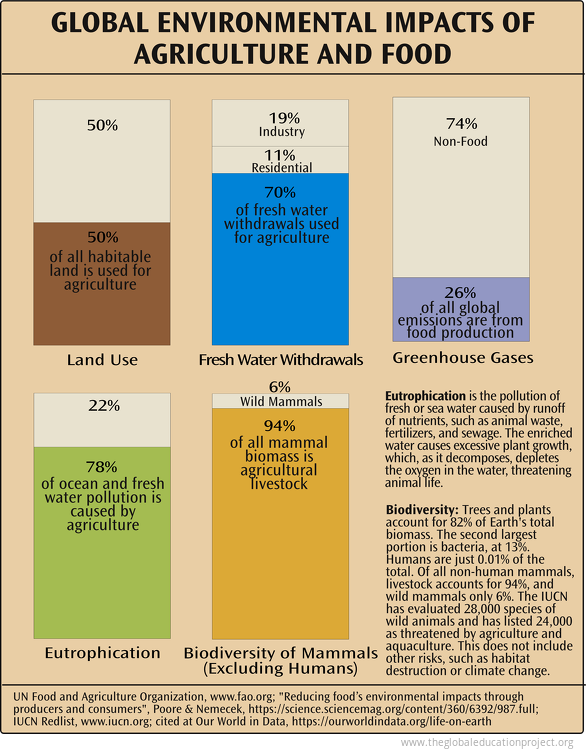
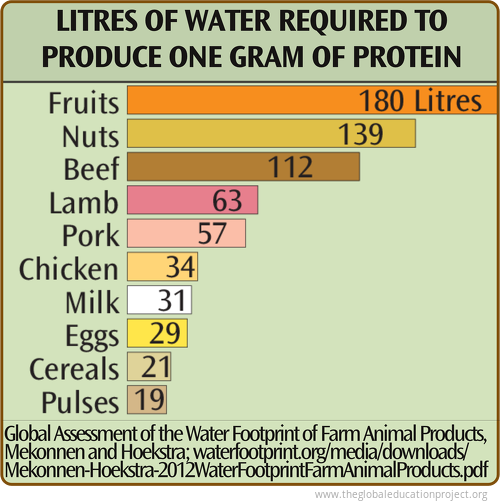
Agricultural and food production has changed dramatically in the past 100 years as increasing population and consumption put pressure on the world's food supply. A look at the environmental impacts of agriculture and food; global distribution and nutrition;...
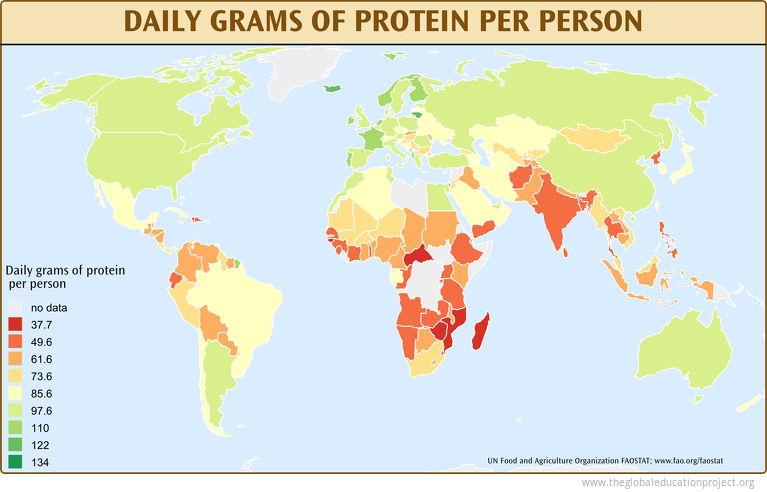 "Severe food insecurity is higher in 2017 than it was in 2014 in every region except Northern America and Europe, with notable increases in Africa and Latin America."
--UN FAO State of Food Security and Nutrition in the World 2018
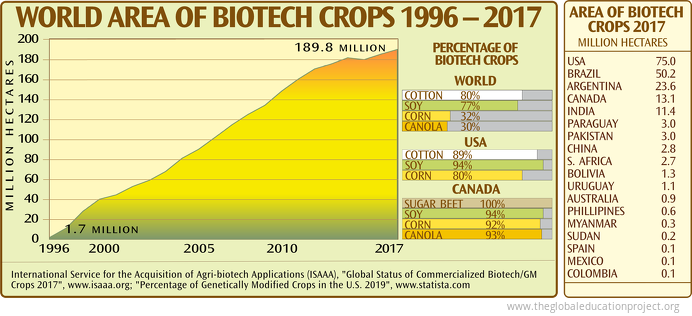 The development and release of genetically engineered organisms and their products has proceeded globally at a rapid rate, facilitated by vigorous partnerships between governments, scientists and corporations. 206 GMO crops are approved for use in the...
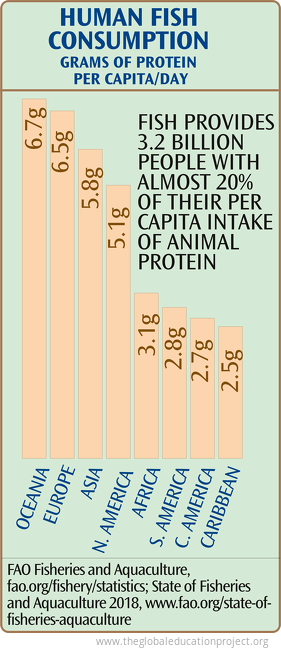 In 2015, fish accounted for about 17% of animal protein, and 7% of all proteins, consumed by the global population. Since 1961, the global average annual increase in fish consumption for food has outpaced population growth and exceeded consumption of...
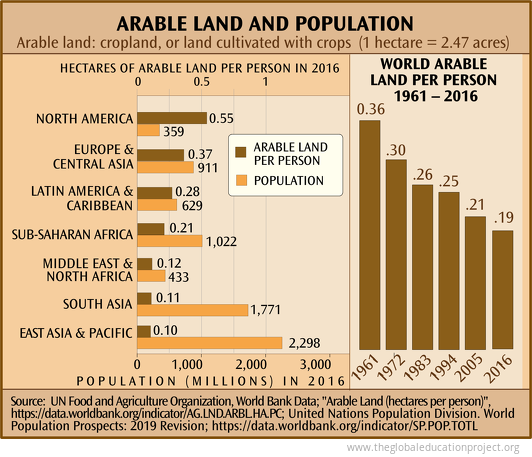 "In 1960, when the world population numbered only 3 billion, approximately 0.5 hectare of cropland per capita was available, the minimum area considered essential for the production of a diverse, healthy, nutritious diet of plant and animal products like...
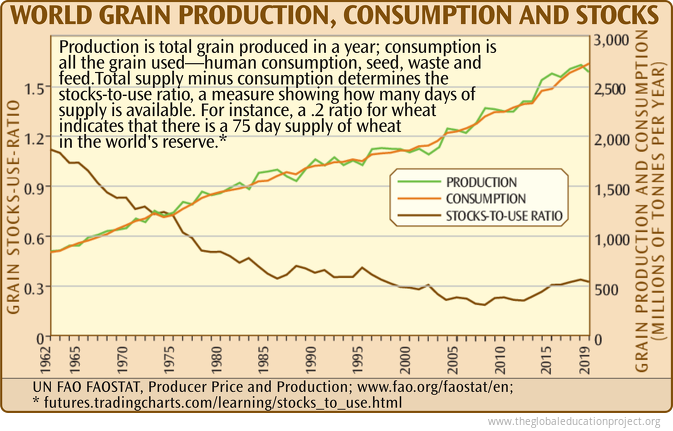 Increases in grain production brought about by irrigation and synthetic fertilizer and pesticide inputs have peaked and begun declining. As consumption surpasses production, the world's stocks of stored grain have been falling relative to each year's...
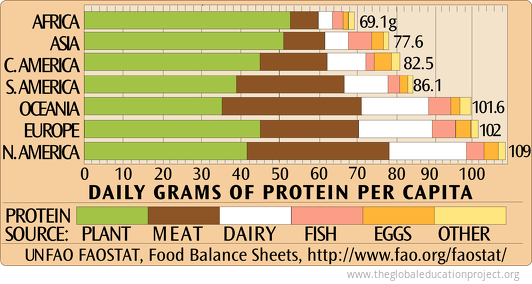
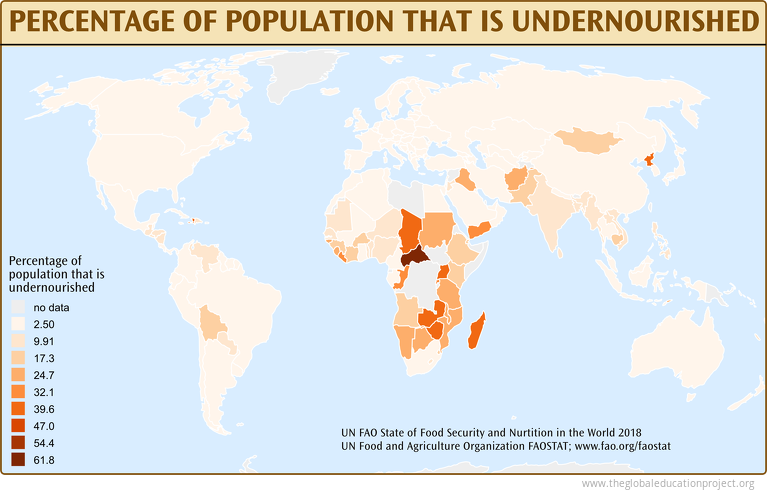 After a prolonged decline, recent estimates show global hunger increased in 2016. The failure to reduce world hunger is closely associated with the increase in conflict and violence in several parts of the world. In addition, gains made in ending hunger...
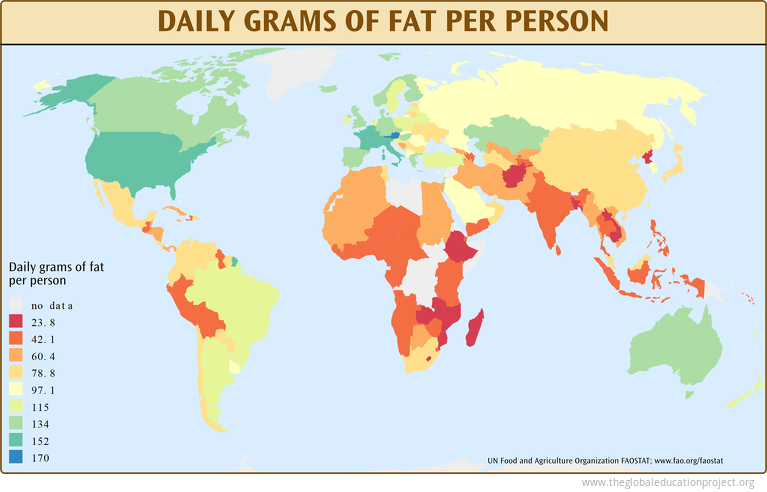
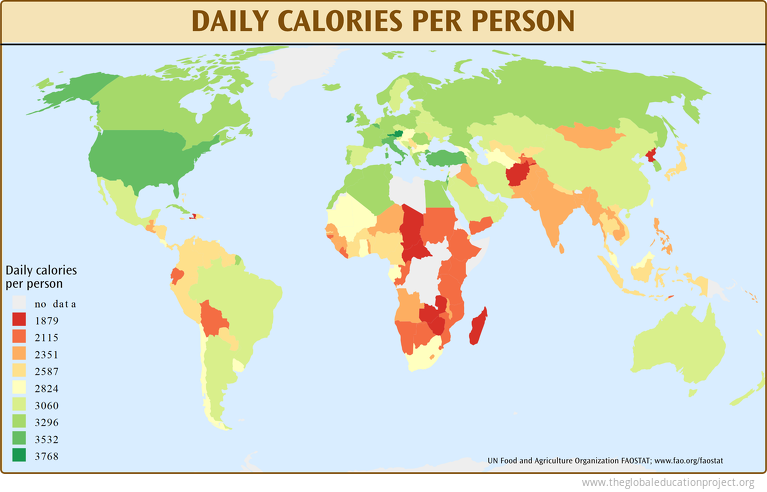
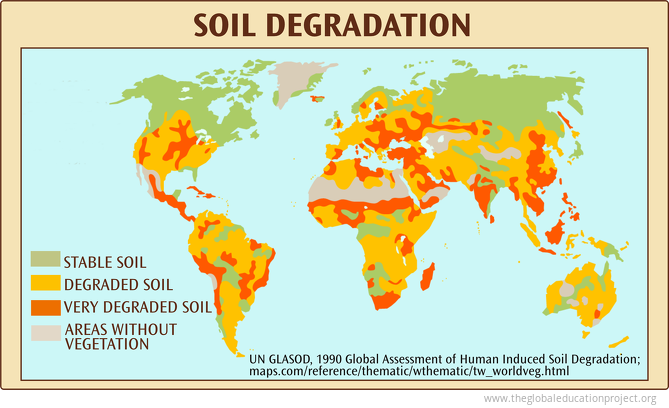 An estimated 75% of the Earth’s land surface has been degraded through human activities, negatively impacting the well-being of at least 3.2 billion people, pushing the planet towards a sixth mass species extinction, and costing more than 10% of the...
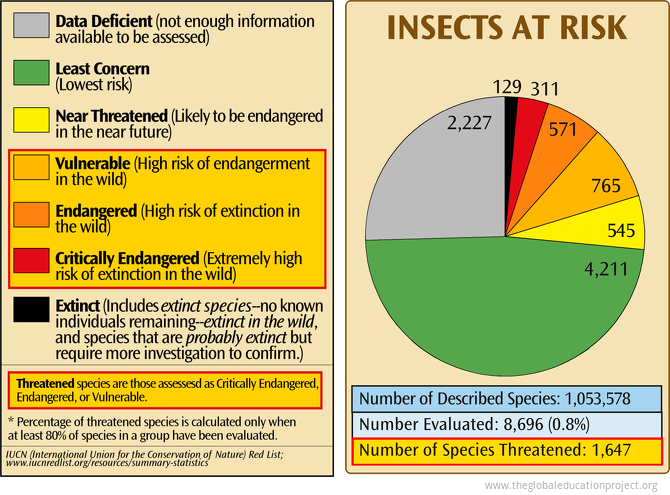 Insects play a central role in a variety of ecosystem processes, including: pollination, nutrient cycling and providing food sources for birds, mammals and amphibians. 80% of wild plants are estimated to depend on insects for pollination and 60% of birds...
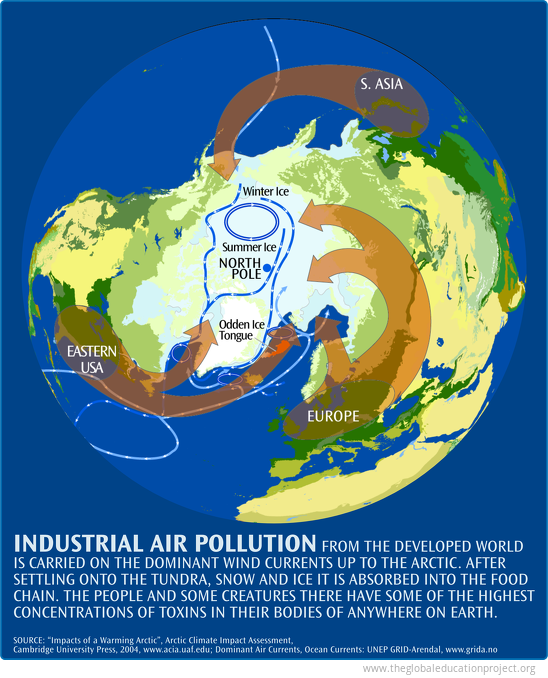 Industrial air pollution from the developed world is carried on the dominant wind currents up to the Arctic. After settling onto the tundra, snow and ice, it is absorbed into the food chain. The people and creatures there have had some of the highest...
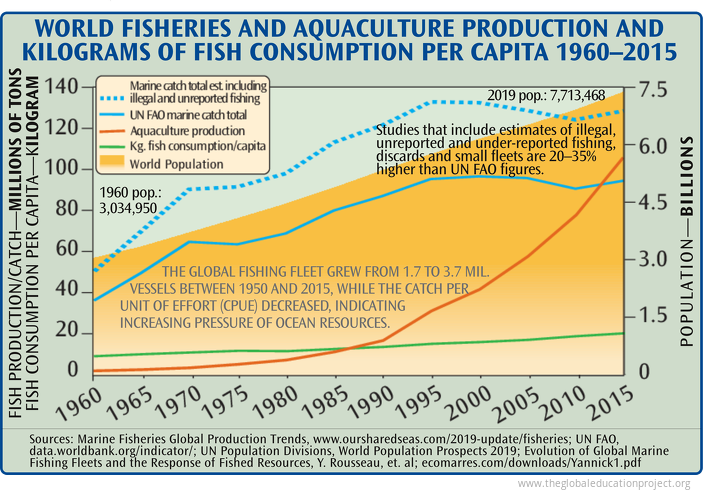
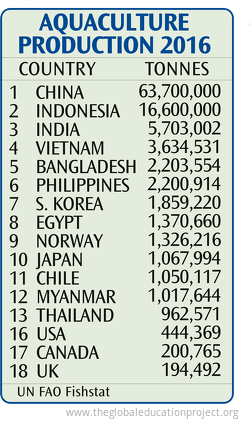 AQUACULTURE is the industrial farming in fresh or salt water of fish, mollusks, crustaceans and plants.
Aquaculture is rapidly increasing its annual global harvest and seems to offer hope for increased food production. However, for some of the more than...
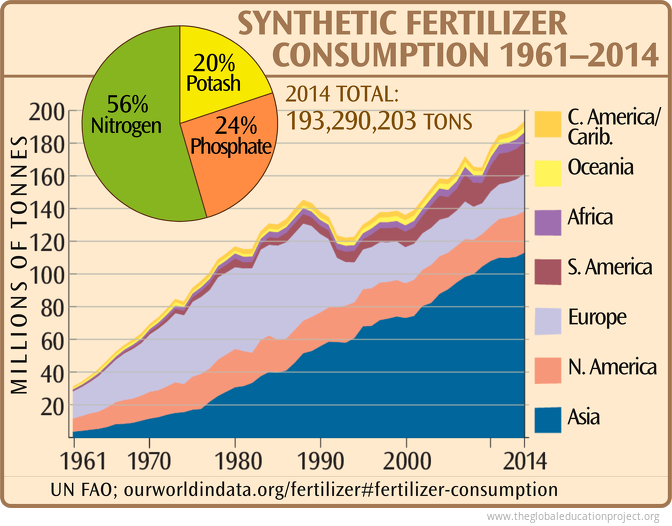 Nitrogen fertilizer production requires a large and affordable supply of natural gas.
Natural gas is a key feedstock (up to 90 percent of the total costs) in the manufacturing of nitrogen fertilizer for which there is no practical substitute. Nitrogen...
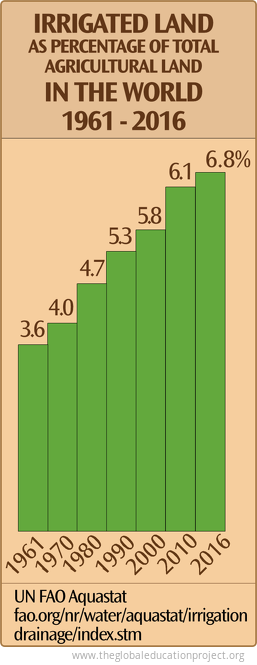
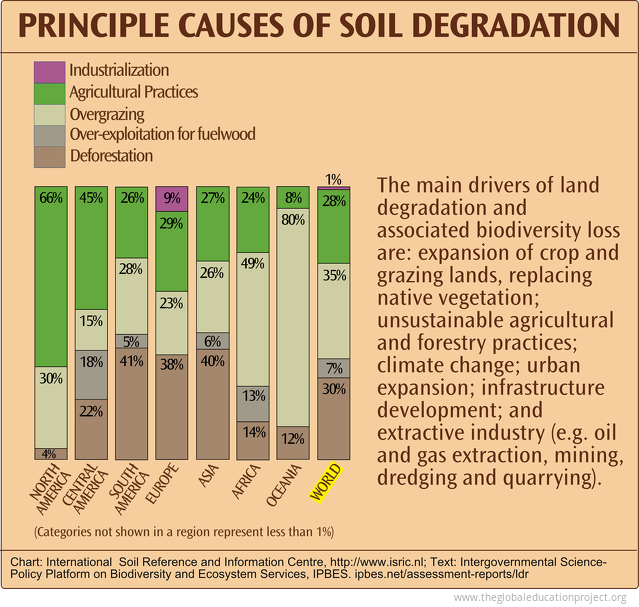 "About 2 million hectares of rainfed and irrigated agricultural lands are lost to production every year due to severe land degradation, among other factors." [1]
"It takes approximately 500 years to replace 25 millimeters (1 inch) of topsoil lost to...
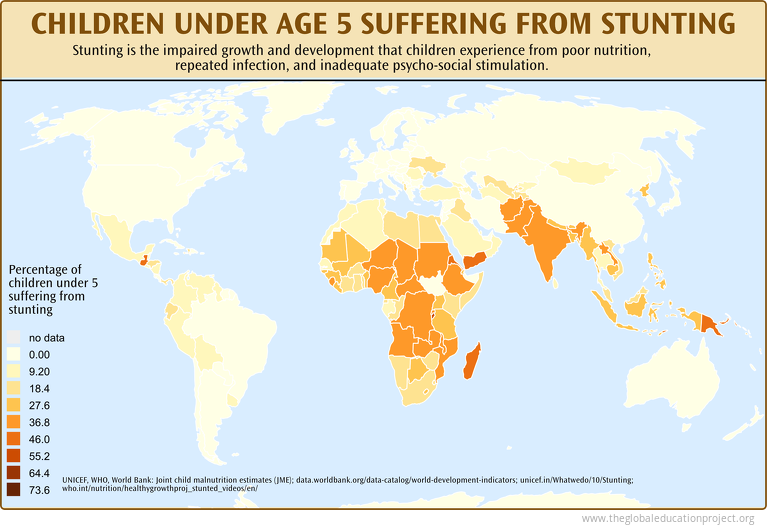 In 2020, nearly 144 million children under 5 suffer from stunting (under height), 47.0 million children under 5 were wasted (underweight) , and of those, 14.3 million were considered severely wasted. Stunting and other forms of under-nutrition are thought...
Clear, factual information on the trends of life expectancy; which diseases are causing what share of deaths in the world and North America; a historical and contemporary look at the AIDS epidemic; alcohol and drug use disorders.
Page 1 of 1
Sign up for EARTH Dispatches
Enter you email below to get jaw dropping charts and maps delivered straight to your inbox.
Get the EARTH presentation
A 150 page high-resolution PDF containing all updated maps, charts and data on EARTH website; use as an information-packed educational slide show, printed booklet or a set of single-page handouts.
Learn More
