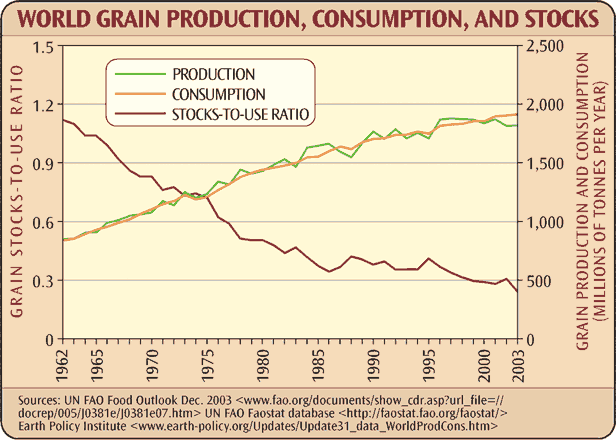
Chart of World Grain Production, Consumption, and Stocks

Increases in grain production brought about by irrigation and synthetic fertilizer and pesticide inputs have peaked and begun declining. As consumption surpasses production, the world's stocks of stored grain have been falling relative to each year's use. When supply can no longer meet demand, free market price competition may starve the poor.
2005 version of this chart
More Agriculture & Food Infographics


Sources
*futures.tradingcharts.com/learning/stocks_to_use.html
Tags: food distribution, grain, world grain production, consumption, and stocks, agriculture-food
Sign up for EARTH Dispatches
Enter you email below to get jaw dropping charts and maps delivered straight to your inbox.
Get the EARTH presentation
A 150 page high-resolution PDF containing all updated maps, charts and data on EARTH website; use as an information-packed educational slide show, printed booklet or a set of single-page handouts.
Learn More
