Population
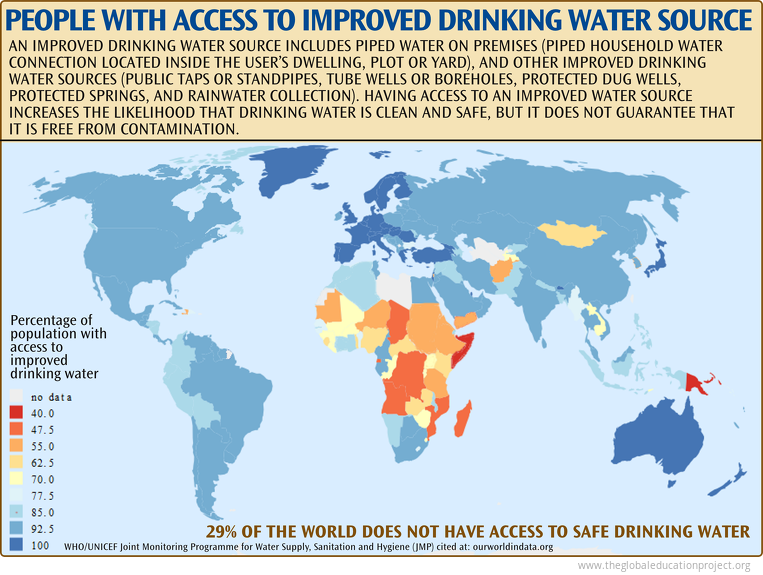
The essential data about population explained in 15 infographics. Detailed charts, maps and images covering arable land and population, human population growth by region, percentage of the population that is undernourished, percentage of population with reasonable access to safe drinking water and more. Learn the truth about population and how it relates to the state of the world on The Global Education Project website with un-biased facts from the most reliable sources.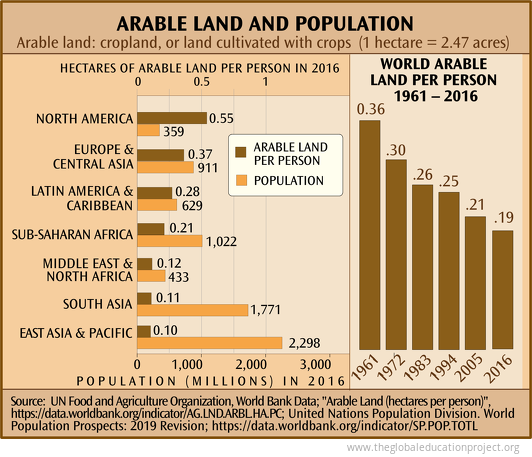 "In 1960, when the world population numbered only 3 billion, approximately 0.5 hectare of cropland per capita was available, the minimum area considered essential for the production of a diverse, healthy, nutritious diet of plant and animal products like...
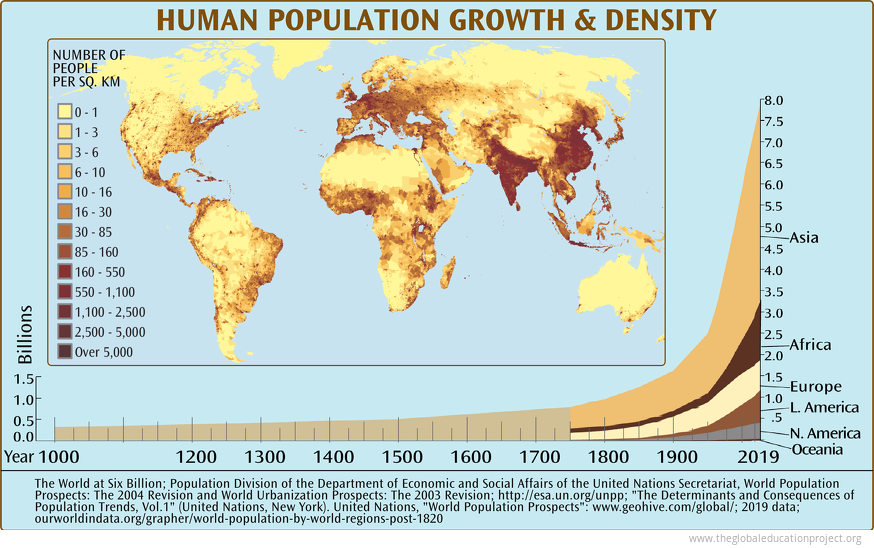 Directly or indirectly, the human species already captures nearly 40% of the total biological productivity on land and 70% of the productivity of the marine environment — the "net primary productivity" of the planet — for its exclusive use. The rate...
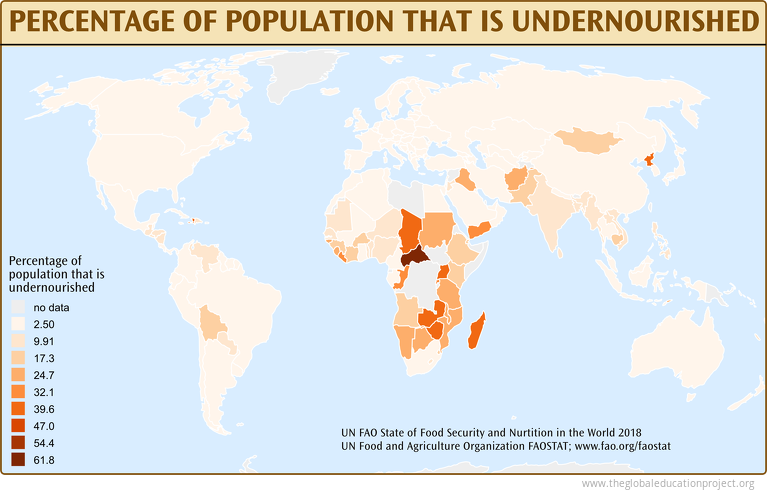 After a prolonged decline, recent estimates show global hunger increased in 2016. The failure to reduce world hunger is closely associated with the increase in conflict and violence in several parts of the world. In addition, gains made in ending hunger...
 In 2018, the Center for Disease Control reported that US life expectancy had declined in recent years, a trend largely attributed to drug overdose and suicide. Suicide rates in the US have risen by 30% since 1999.
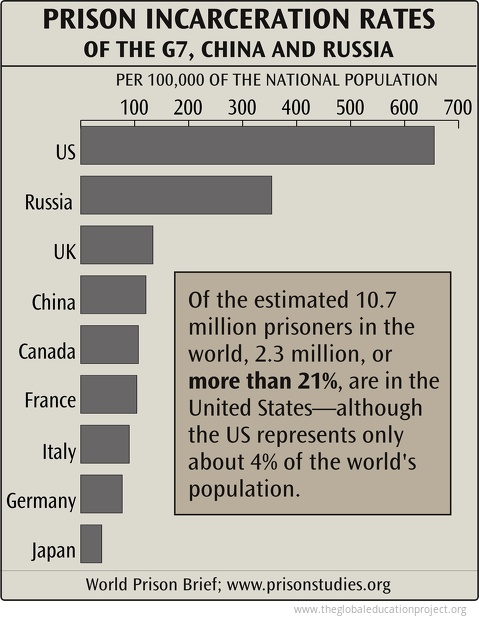
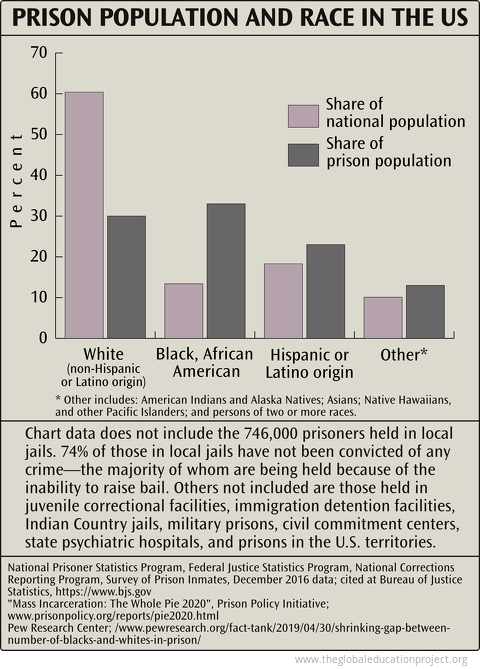 Chart data does not include the 746,000 prisoners held in local jails. 74% of those in local jails have not been convicted of any crime—the majority of whom are being held because of the inability to raise bail. Others not included are those held in...
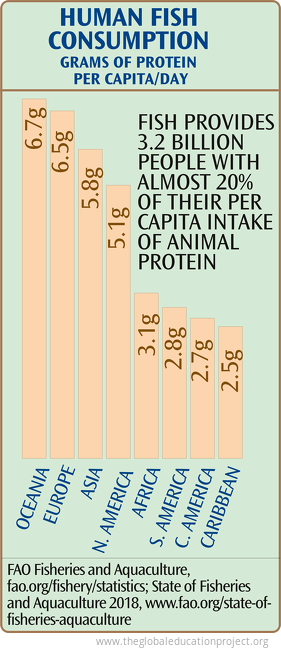 In 2015, fish accounted for about 17% of animal protein, and 7% of all proteins, consumed by the global population. Since 1961, the global average annual increase in fish consumption for food has outpaced population growth and exceeded consumption of...
Population, pollution, greenhouse gases and deforestation are creating never before seen changes in Earth's living systems—including a cultural and species extinction rate that is the highest in the planet's history.
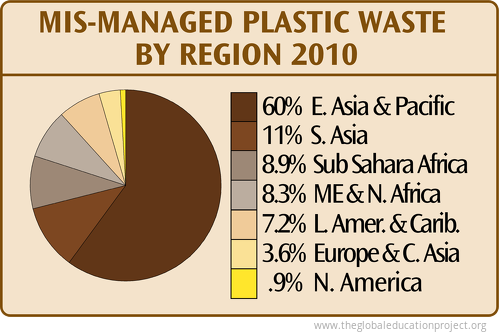 The amount of plastic debris that ends up in the oceans from the land is mostly determined by population size living within 50km of a coast and by the amount of plastic waste that is mismanaged—either littered or disposed into uncontained dumps or landfills....
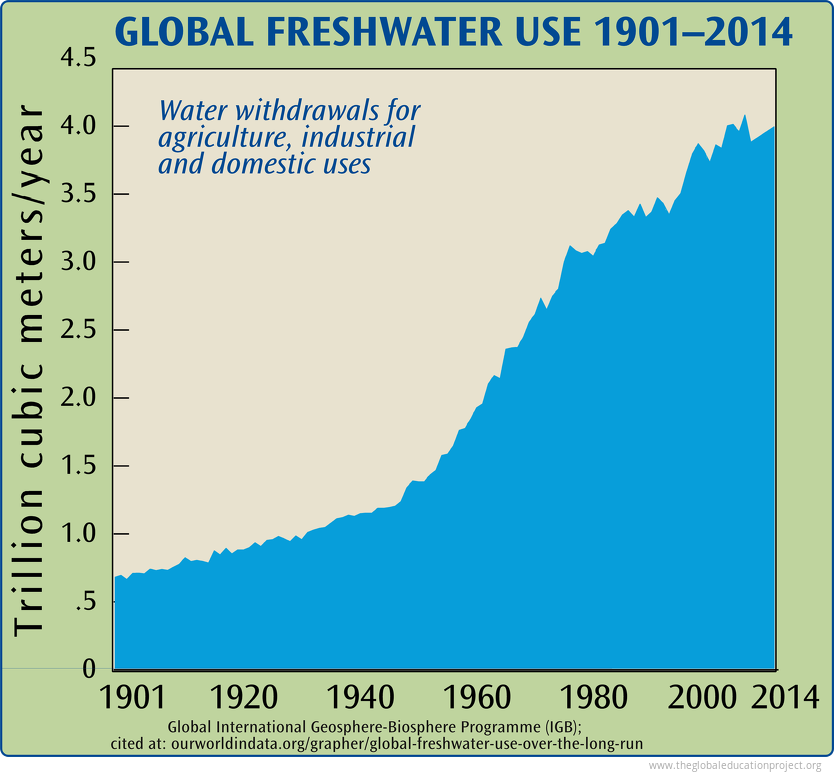 Over 2 billion people live in countries experiencing high water stress.
An estimated 4 billion people, nearly two-thirds of the world population, experience severe water scarcity during at least one month of the year. Growing use of water resources...
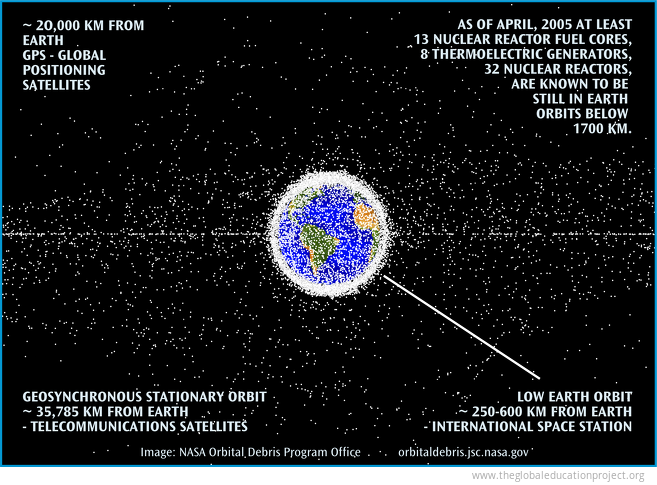 SPACE DEBRIS
Before 1961, the entire Earth satellite population was just over 50 objects. Since 1957, about 9,600 satellites have been launched and about 5500 are still in space—and 2300 of these are still functioning. The total mass of all space objects...
Agricultural and food production has changed dramatically in the past 100 years as increasing population and consumption put pressure on the world's food supply. A look at the environmental impacts of agriculture and food; global distribution and nutrition;...
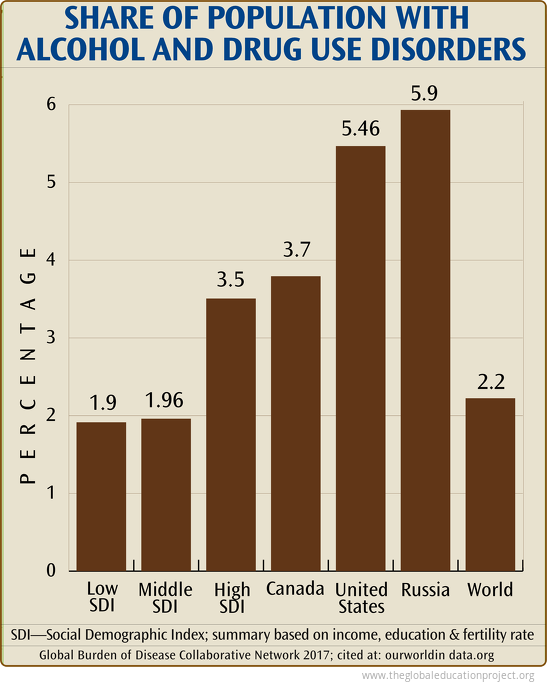
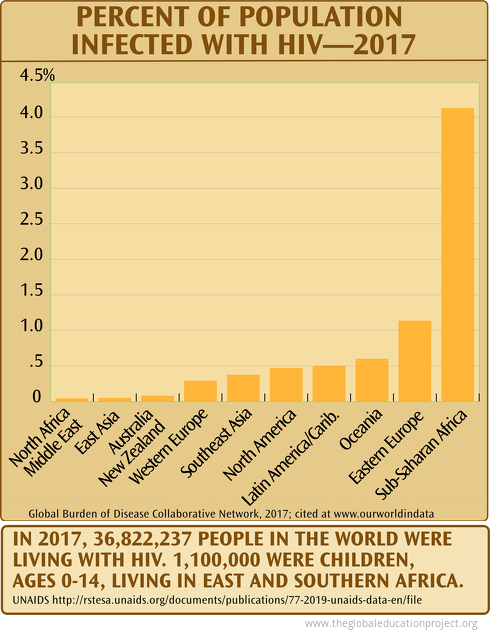
Clear, factual information on the trends of life expectancy; which diseases are causing what share of deaths in the world and North America; a historical and contemporary look at the AIDS epidemic; alcohol and drug use disorders.
Page 1 of 1
Sign up for EARTH Dispatches
Enter you email below to get jaw dropping charts and maps delivered straight to your inbox.
Get the EARTH presentation
A 150 page high-resolution PDF containing all updated maps, charts and data on EARTH website; use as an information-packed educational slide show, printed booklet or a set of single-page handouts.
Learn More
