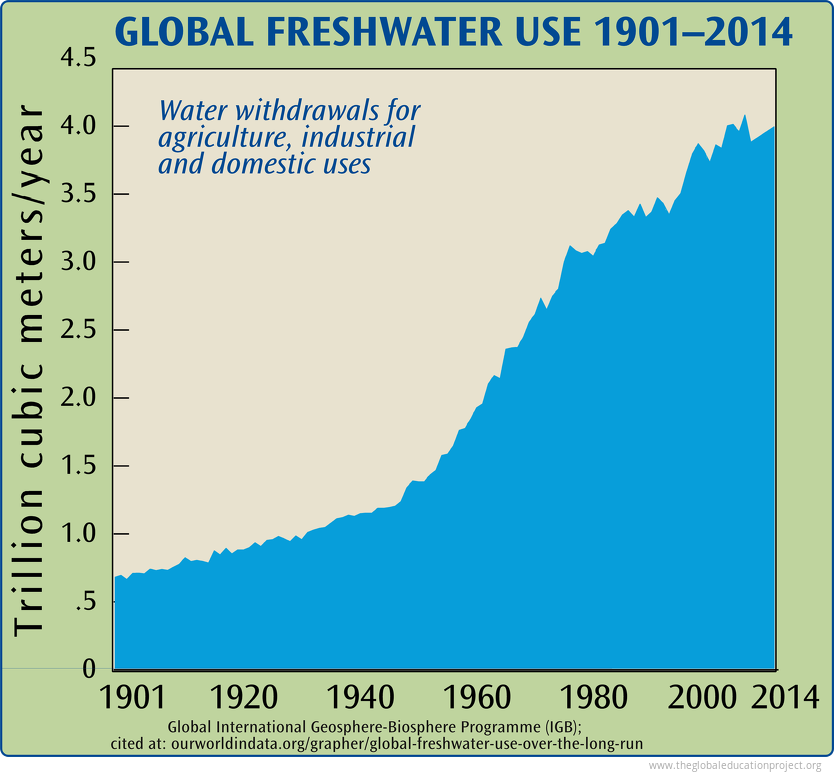
Chart of Global Fresh Water Use 1901-2014
Over 2 billion people live in countries experiencing high water stress.
An estimated 4 billion people, nearly two-thirds of the world population, experience severe water scarcity during at least one month of the year. Growing use of water resources impacts sustainability, and creates a rising potential for conflicts among users.
Water use has been increasing worldwide by about 1% per year since the 1980s and is expected to increase by 20% to 30% until 2050. The increase is mainly occurring in developing countries and emerging economies. Per capita water use in most of these countries remains far below developed countries—they are merely catching up.
As the climate changes, dry areas will tend to become drier and wet areas wetter—exacerbating water stress in areas already the most affected. [1]
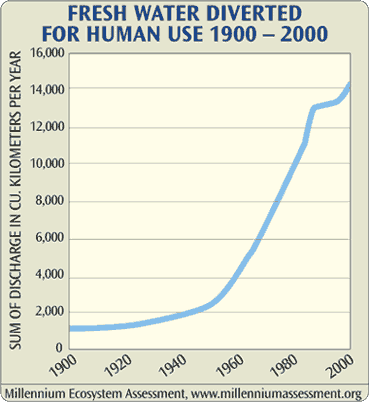
2005 version of this chart
Sources
1. The United Nations World Water Development Report 2019, "Leaving No One Behind"; https://en.unesco.org/themes/water-security/wwap/wwdr/2019
Tags: global freshwater, water withdrawals, historical use of fresh water, global fresh water use 1901-2014, fresh-water
Sign up for EARTH Dispatches
Enter you email below to get jaw dropping charts and maps delivered straight to your inbox.
Get the EARTH presentation
A 150 page high-resolution PDF containing all updated maps, charts and data on EARTH website; use as an information-packed educational slide show, printed booklet or a set of single-page handouts.
Learn More
