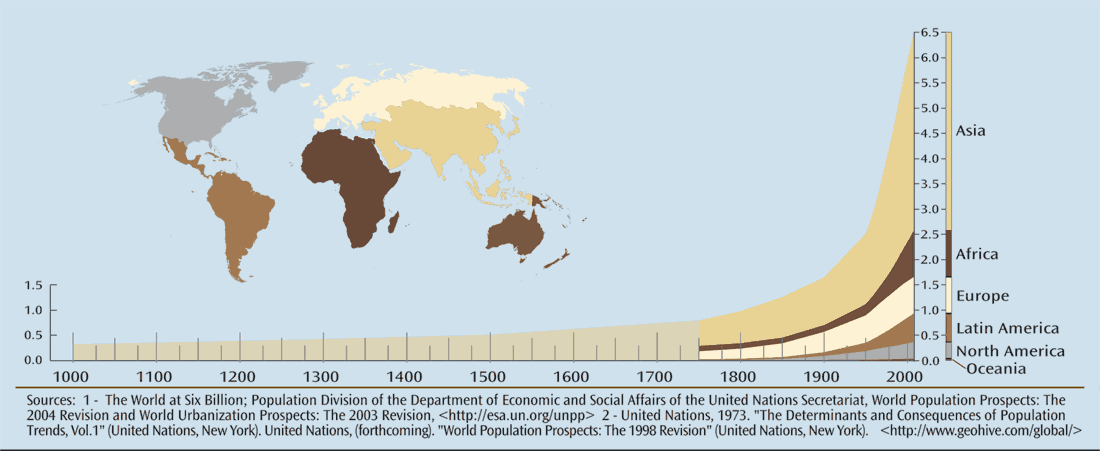
Chart of Human Population Growth by Region
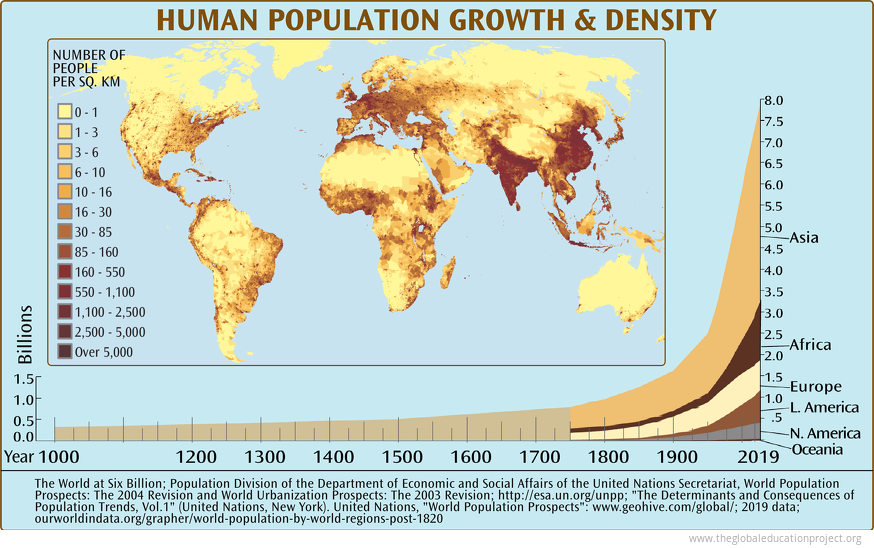
Directly or indirectly, the human species already captures nearly 40% of the total biological productivity on land and 70% of the productivity of the marine environment — the "net primary productivity" of the planet — for its exclusive use. The rate of increase in human use is about 2% per year."
2005 version of this chart
Sources
Map Data Source: Center for International Earth Science Information Network, Columbia University, “Grided Population of the World”
Text: UNESCO World Water Assessment Programme, Office for Global Water Assessment; www.unesco.org/water/wwap
Tags: population growth, population growth by region, population of the world since the year 1000, human population growth by region, global-ecology
Sign up for EARTH Dispatches
Enter you email below to get jaw dropping charts and maps delivered straight to your inbox.
Get the EARTH presentation
A 150 page high-resolution PDF containing all updated maps, charts and data on EARTH website; use as an information-packed educational slide show, printed booklet or a set of single-page handouts.
Learn More
