Greenhouse Gas Emissions
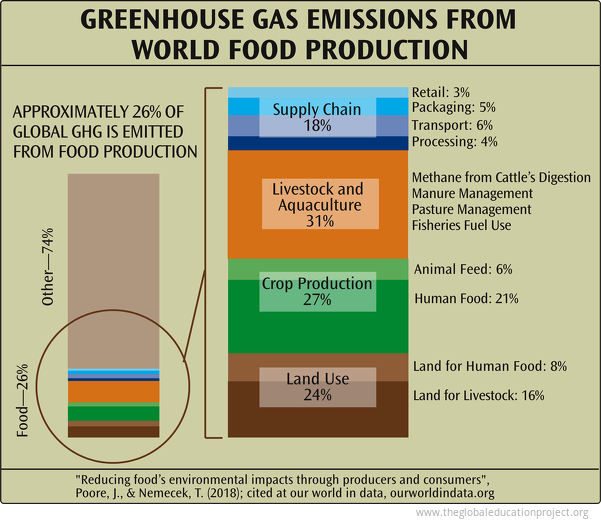
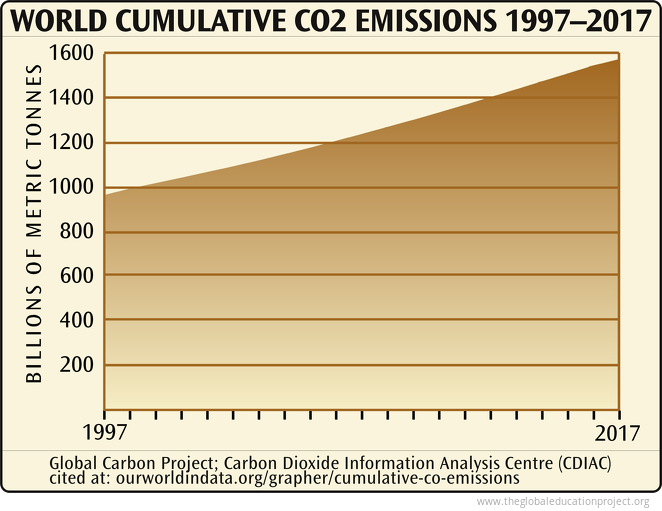
The essential data about greenhouse gas emissions explained in 5 infographics. Detailed charts covering greenhouse gas emissions per kilogram of food, greenhouse gas and food production, world cumulative co2 emissions, climate and more. Learn the truth about greenhouse gas emissions and how it relates to the state of the world on The Global Education Project website with un-biased facts from the most reliable sources.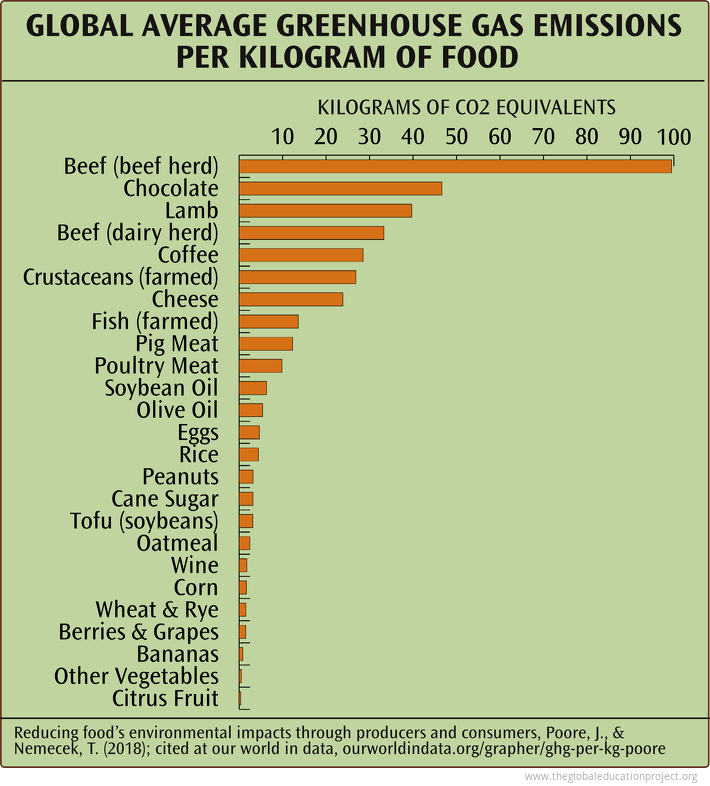
Historical and contemporary overview of greenhouse gas emissions and atmospheric concentrations—which countries emit the most CO2, total and per capita; methane; ocean warming and sea level rise; global temperature projections; glacier and ice loss.
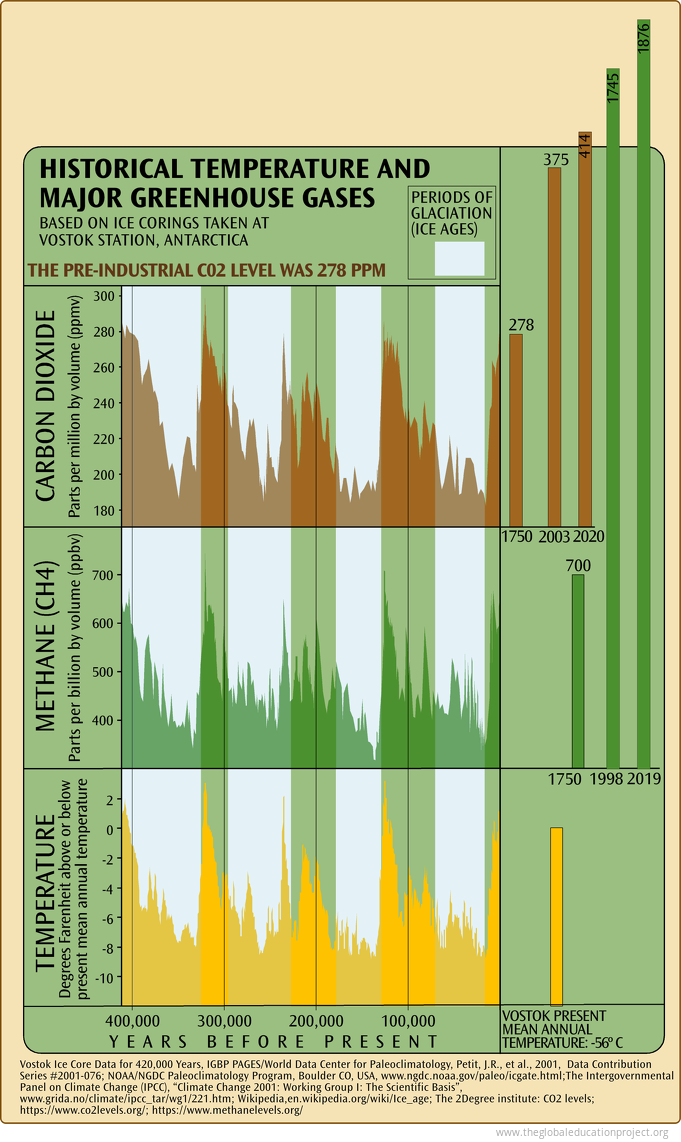 CO2 concentrations are well above historic maximum levels.* The GWP (Global Warming Potential) of methane gas (CH4) is greater than the GWP of CO2. Warming could release vast quantities of CH4 from thawing tundra and seabed methane hydrates.
*Levels...
Page 1 of 1
Sign up for EARTH Dispatches
Enter you email below to get jaw dropping charts and maps delivered straight to your inbox.
Get the EARTH presentation
A 150 page high-resolution PDF containing all updated maps, charts and data on EARTH website; use as an information-packed educational slide show, printed booklet or a set of single-page handouts.
Learn More
