Ecology
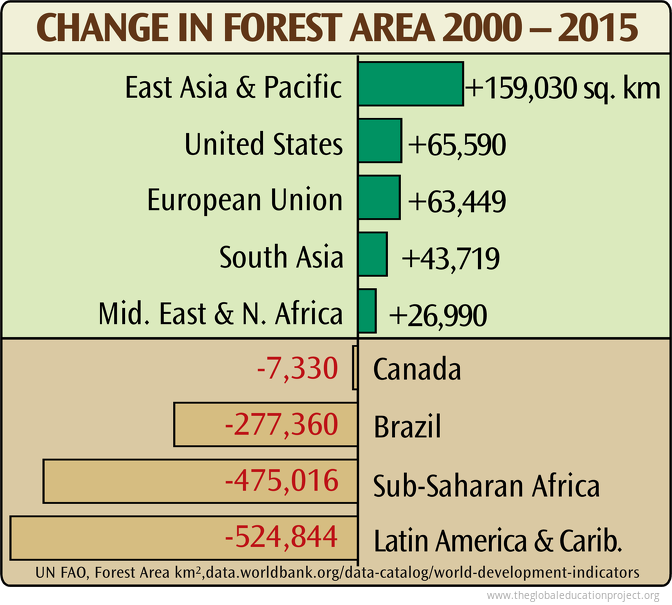
The essential data about ecology explained in 21 infographics. Detailed charts, maps and images covering global ecology, forest land as percentage of total land area 1990 and 2016, world forest area 1990 - 2015, global forest and more. Learn the truth about ecology and how it relates to the state of the world on The Global Education Project website with un-biased facts from the most reliable sources.Population, pollution, greenhouse gases and deforestation are creating never before seen changes in Earth's living systems—including a cultural and species extinction rate that is the highest in the planet's history.
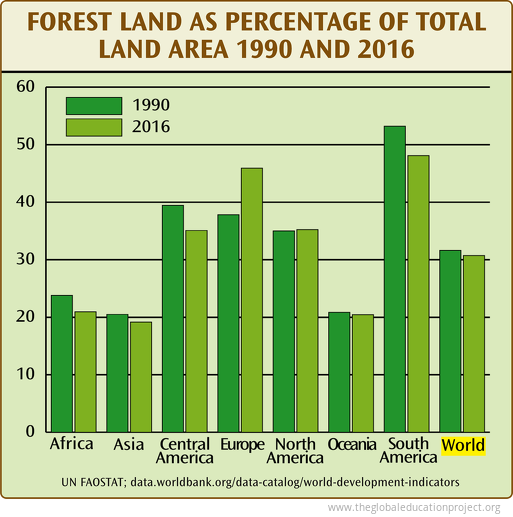
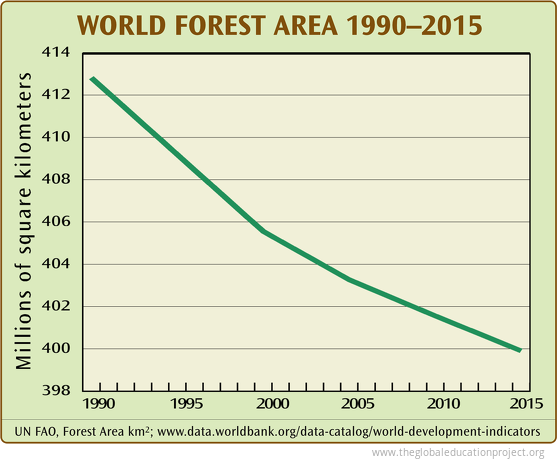
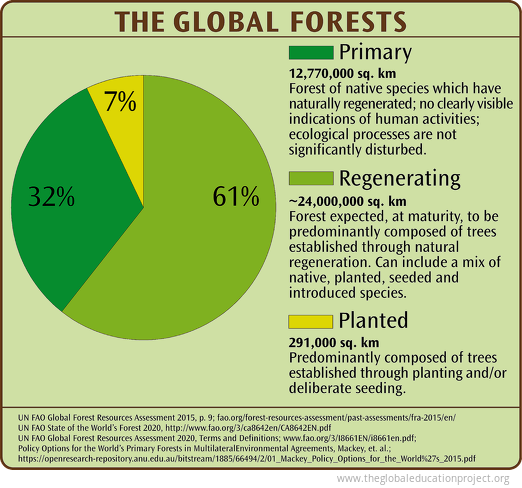 There are just under 40,000,000 sq. km of forest area remaining on Earth.
Of the remaining primary forests, only ~18% are in legally protected forests, which is approximately 5% of the original forest estimated to have covered the planet 8,000 years...
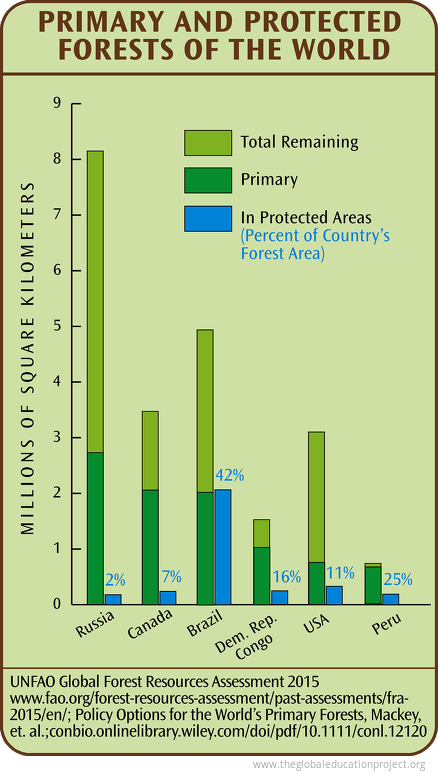 Almost three quarters of Earth's remaining primary forests are in just ten countries. In addition to the countries shown in the above chart, there are only 0.46 million sq km in Indonesia, 0.45 in Venezuela, 0.36 in Bolivia, and 0.33 in Mexico.
A...
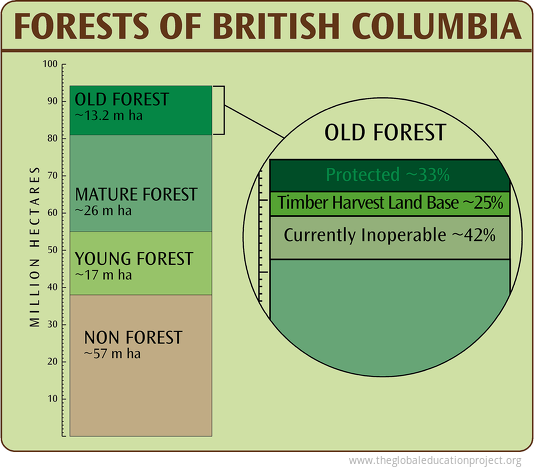 The area of British Columbia is about 95 million hectares. About 55% to 60% of the area is forest. (This precentage varies, depending on what is included; for example, federal land, Indian reserve, private land or water bodies.) Also counted as forest...
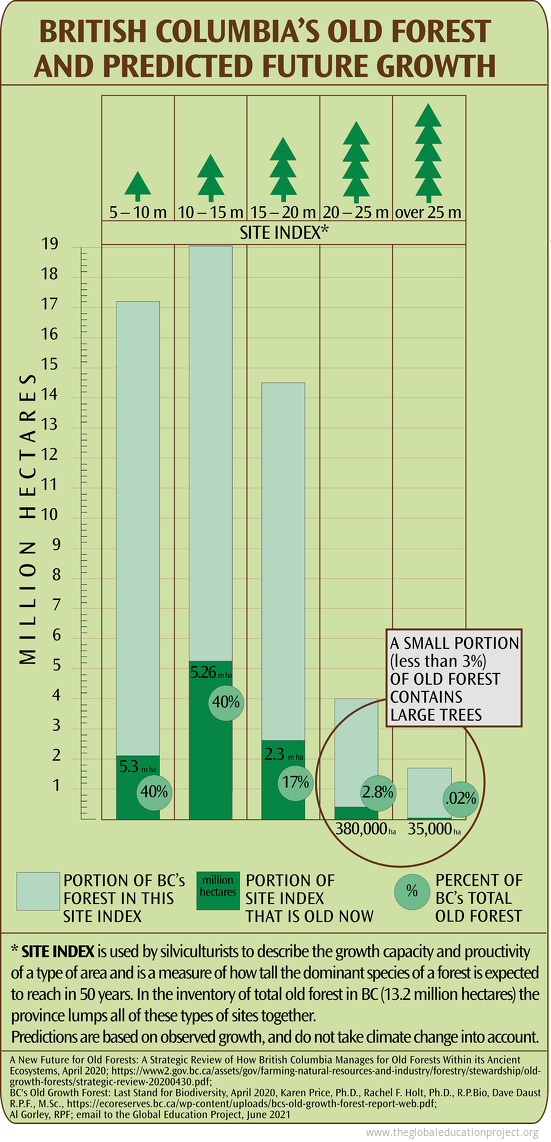 Forest areas with the potential to grow very large trees are extremely rare in Britsh Columbia. Old forests on these sites are almost extinguished and will not recover from logging.
"As much as 80% of the area of old forests consists of relatively...
 A concise and comprehensive overview of the state of the planet and humanity.
Earth's ecological and human systems are in a state of severe crisis. Although there is a wealth of information available about the state of the planet, much of it is fragmented...
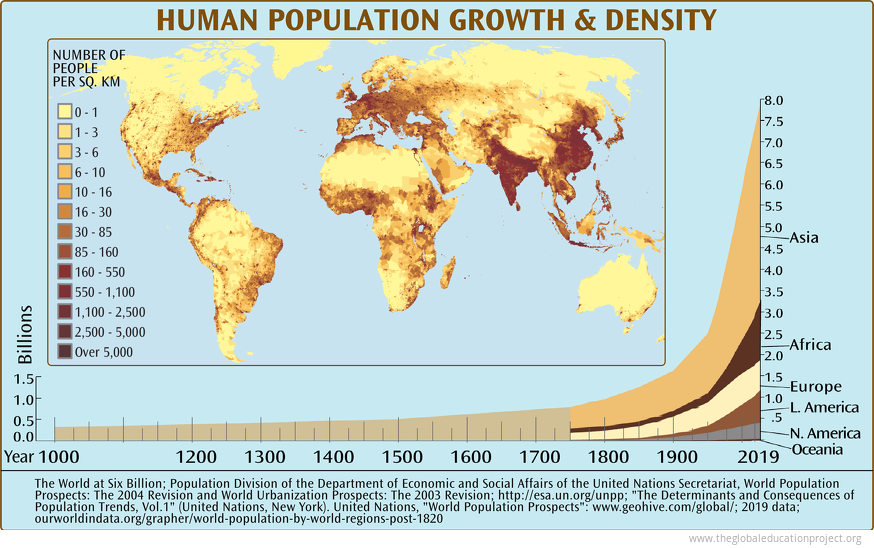 Directly or indirectly, the human species already captures nearly 40% of the total biological productivity on land and 70% of the productivity of the marine environment — the "net primary productivity" of the planet — for its exclusive use. The rate...
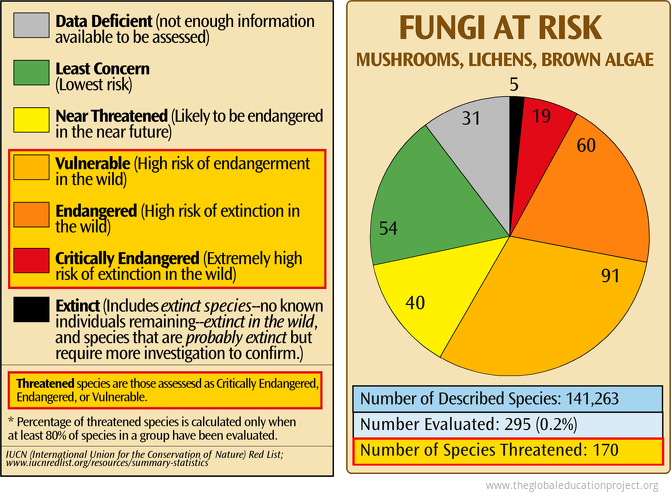
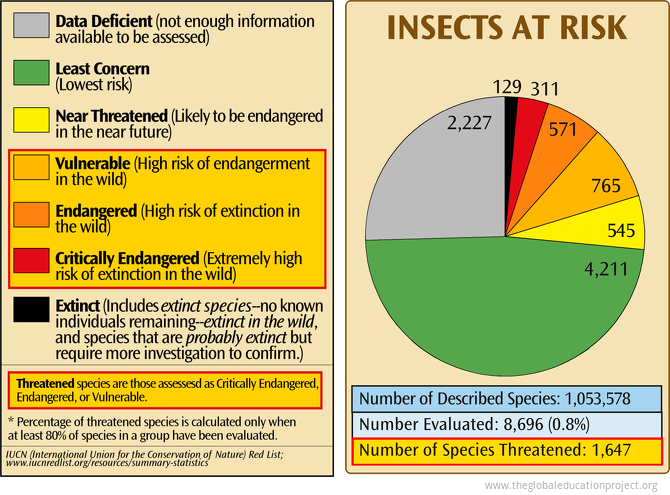 Insects play a central role in a variety of ecosystem processes, including: pollination, nutrient cycling and providing food sources for birds, mammals and amphibians. 80% of wild plants are estimated to depend on insects for pollination and 60% of birds...
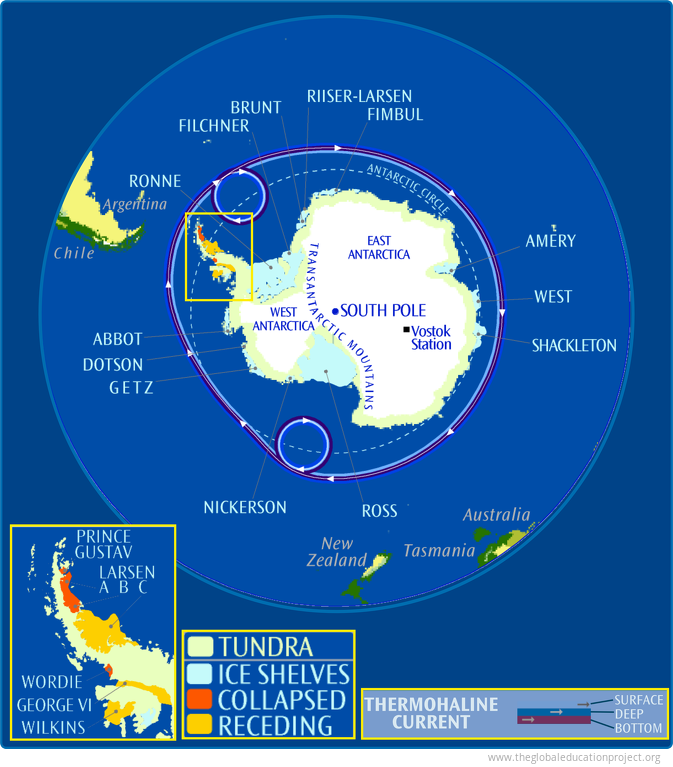
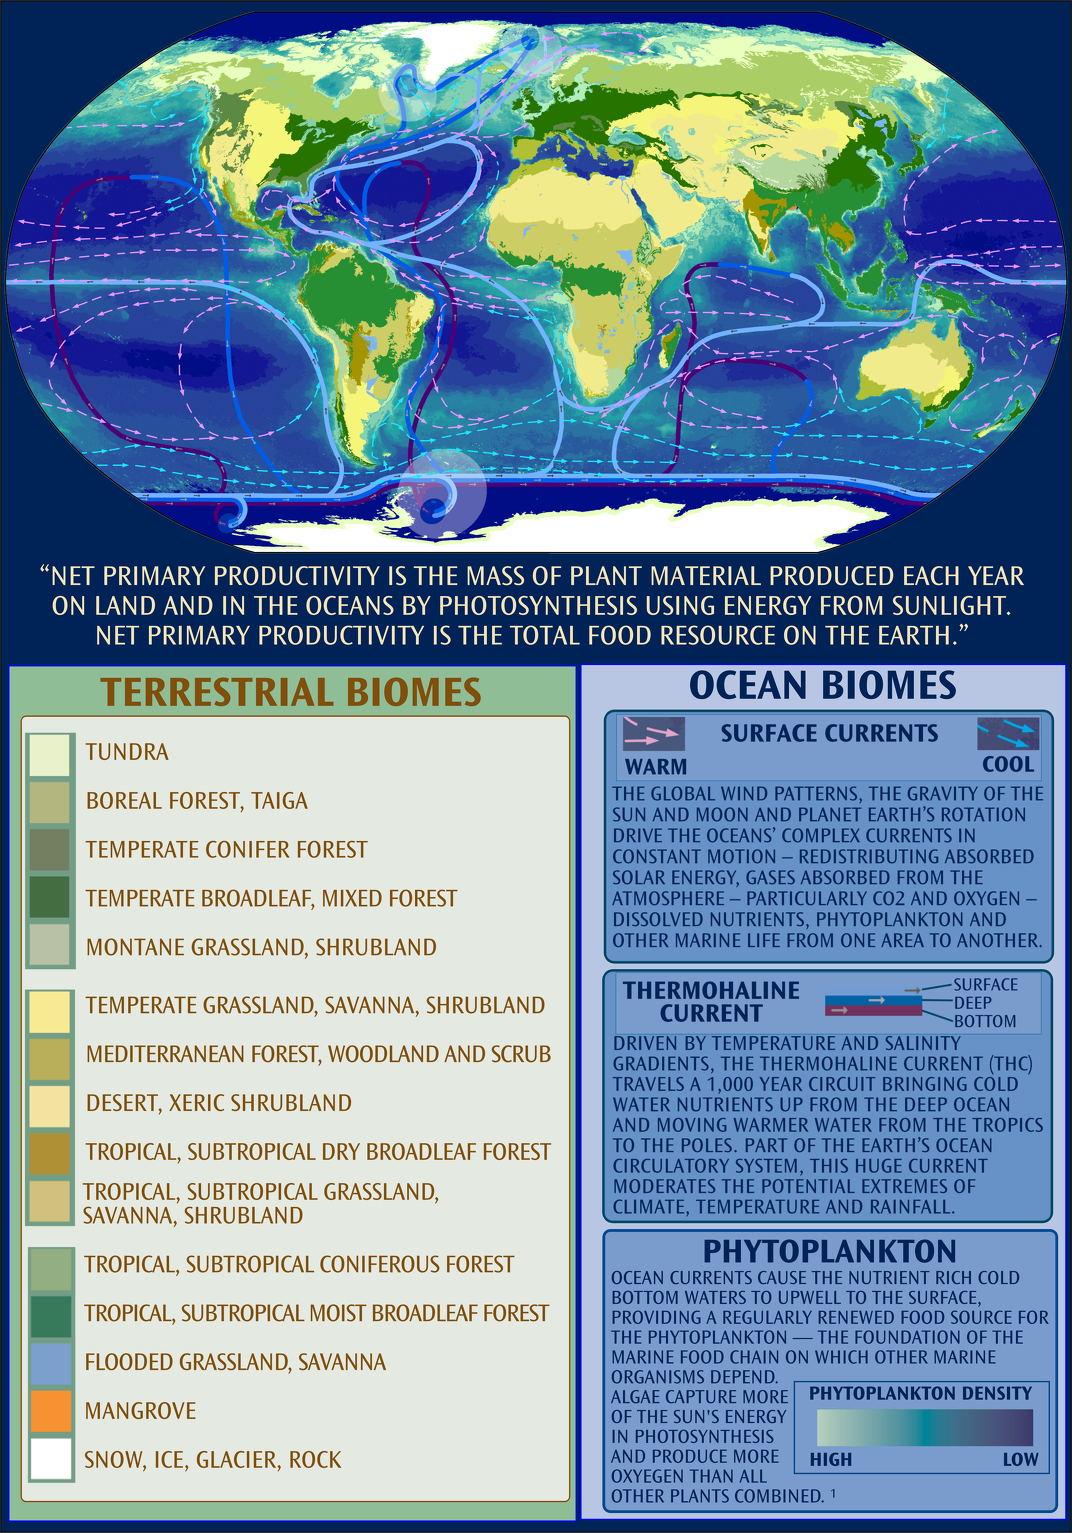 Evidence is growing that the thermohaline circulation, driven by temperature and salinity, could be slowed or stopped by cold fresh water inputs to the Arctic and North Atlantic oceans, diluting the salt concentration in the ocean. This could occur if...
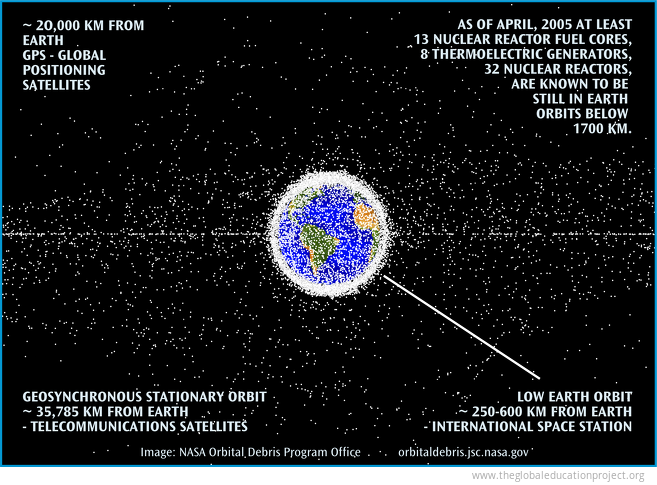 SPACE DEBRIS
Before 1961, the entire Earth satellite population was just over 50 objects. Since 1957, about 9,600 satellites have been launched and about 5500 are still in space—and 2300 of these are still functioning. The total mass of all space objects...
Page 1 of 1
Sign up for EARTH Dispatches
Enter you email below to get jaw dropping charts and maps delivered straight to your inbox.
Get the EARTH presentation
A 150 page high-resolution PDF containing all updated maps, charts and data on EARTH website; use as an information-packed educational slide show, printed booklet or a set of single-page handouts.
Learn More
