Consumption
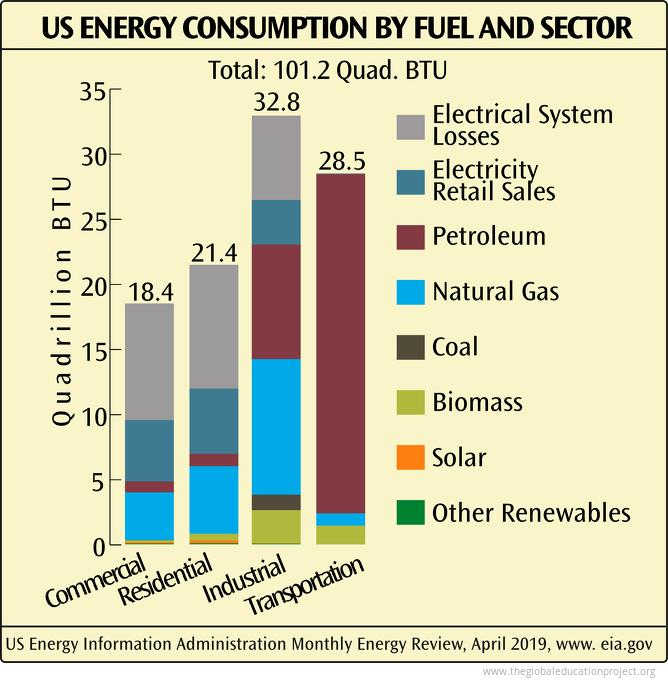
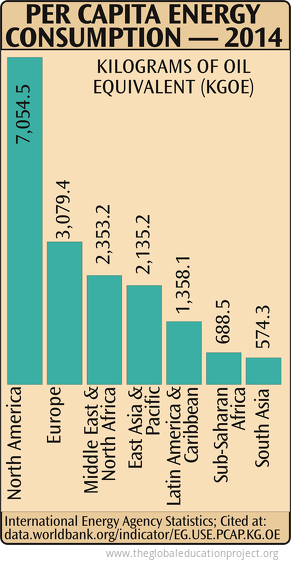
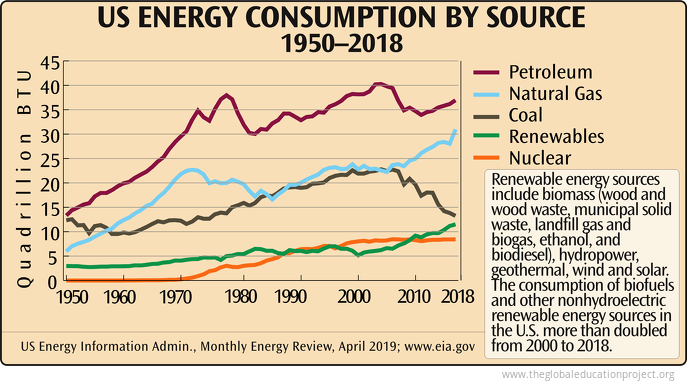
The essential data about consumption explained in 14 infographics. Detailed charts covering fish consumption by region, us energy consumption by fuel and sector, per capita energy consumption 2014, us energy consumption by source 1950-2018 and more. Learn the truth about consumption and how it relates to the state of the world on The Global Education Project website with un-biased facts from the most reliable sources.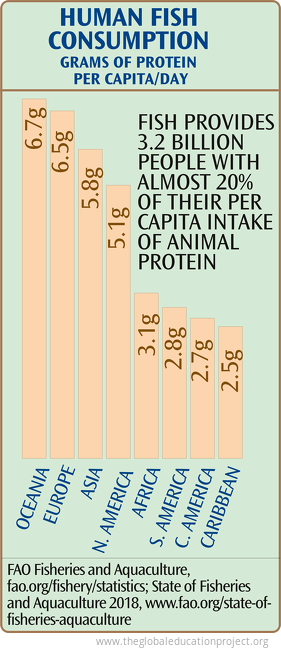 In 2015, fish accounted for about 17% of animal protein, and 7% of all proteins, consumed by the global population. Since 1961, the global average annual increase in fish consumption for food has outpaced population growth and exceeded consumption of...
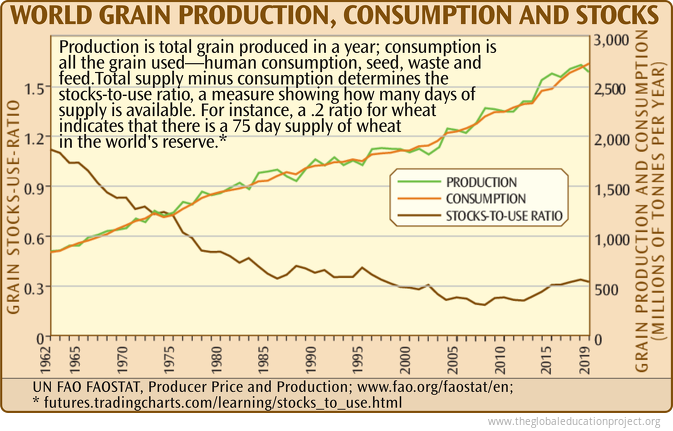 Increases in grain production brought about by irrigation and synthetic fertilizer and pesticide inputs have peaked and begun declining. As consumption surpasses production, the world's stocks of stored grain have been falling relative to each year's...
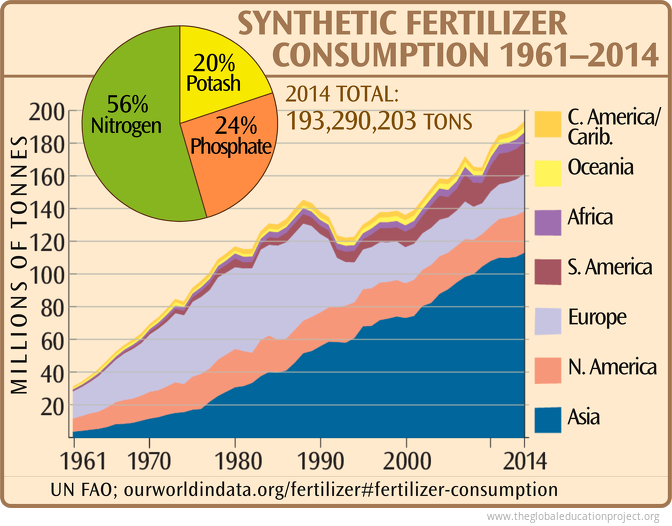 Nitrogen fertilizer production requires a large and affordable supply of natural gas.
Natural gas is a key feedstock (up to 90 percent of the total costs) in the manufacturing of nitrogen fertilizer for which there is no practical substitute. Nitrogen...
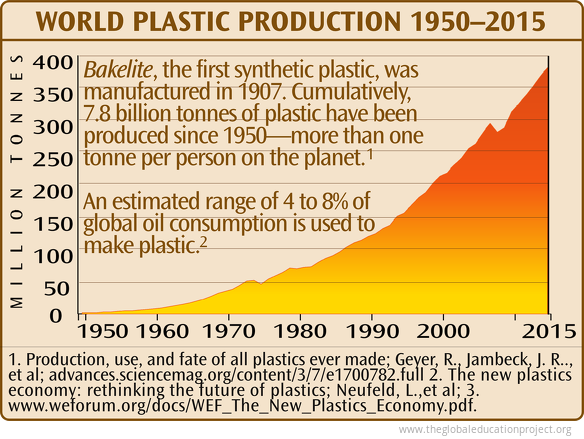 Over 90% of plastics produced are derived from virgin fossil feedstocks—accounting for about 6% of global oil consumption. This is equivalent to the total oil consumption of the global aviation sector.
Industrialized civilization is dependent upon cheap and reliable fossil fuel energy. This section includes a look at production, consumption, remaining known resources and the global carbon budget.
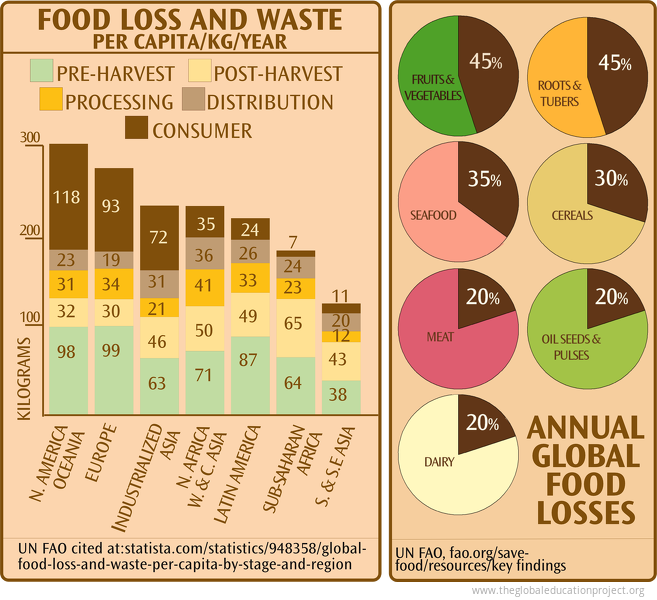 Approximately one third of the food produced in the world for human consumption—nearly 1.3 billion tonnes—gets lost or wasted every year.
"Loss" refers to any food that is lost in the supply chain between the producer and the market from problems...
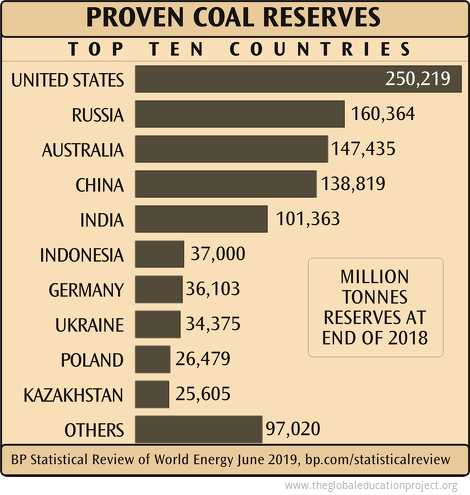 In 2014, coal-powered plants at electrical utilities in the US accounted for 39% of electricity production, 27.5% in 2018, and 23.5% in 2019. The decline is due to increased availability of natural gas, decreased consumption, increase in renewable power,...
Fisheries and aquaculture; fish consumption and utilization; what countries claim as Exclusive Economic Zones (EEZs), and how heavily the world's fish stocks are being exploited; oil in the ocean; coral reefs.
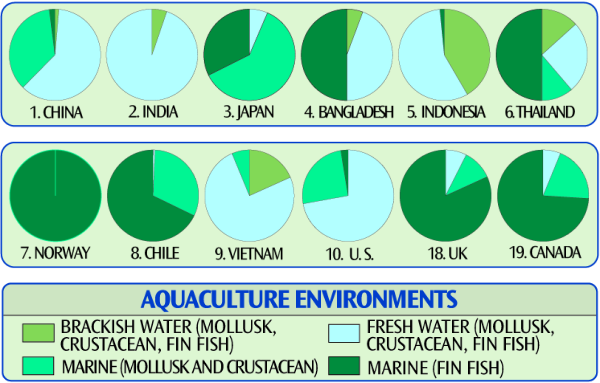 The high protein feed for farmed salmon is largely composed of ocean caught fish meal and meat offal from poultry and hog processing. Because of bio-accumulation of toxins in the feed, "consumption of farmed salmon even at relatively low frequencies results...
Agricultural and food production has changed dramatically in the past 100 years as increasing population and consumption put pressure on the world's food supply. A look at the environmental impacts of agriculture and food; global distribution and nutrition;...
Page 1 of 1
Sign up for EARTH Dispatches
Enter you email below to get jaw dropping charts and maps delivered straight to your inbox.
Get the EARTH presentation
A 150 page high-resolution PDF containing all updated maps, charts and data on EARTH website; use as an information-packed educational slide show, printed booklet or a set of single-page handouts.
Learn More
