Fisheries
The essential data about fisheries explained in 9 infographics. Detailed maps, tables and charts covering global aquaculture and fisheries, fisheries capture by country, total world fisheries and aquaculture production per capita, fishing & aquaculture and more. Learn the truth about fisheries and how it relates to the state of the world on The Global Education Project website with un-biased facts from the most reliable sources.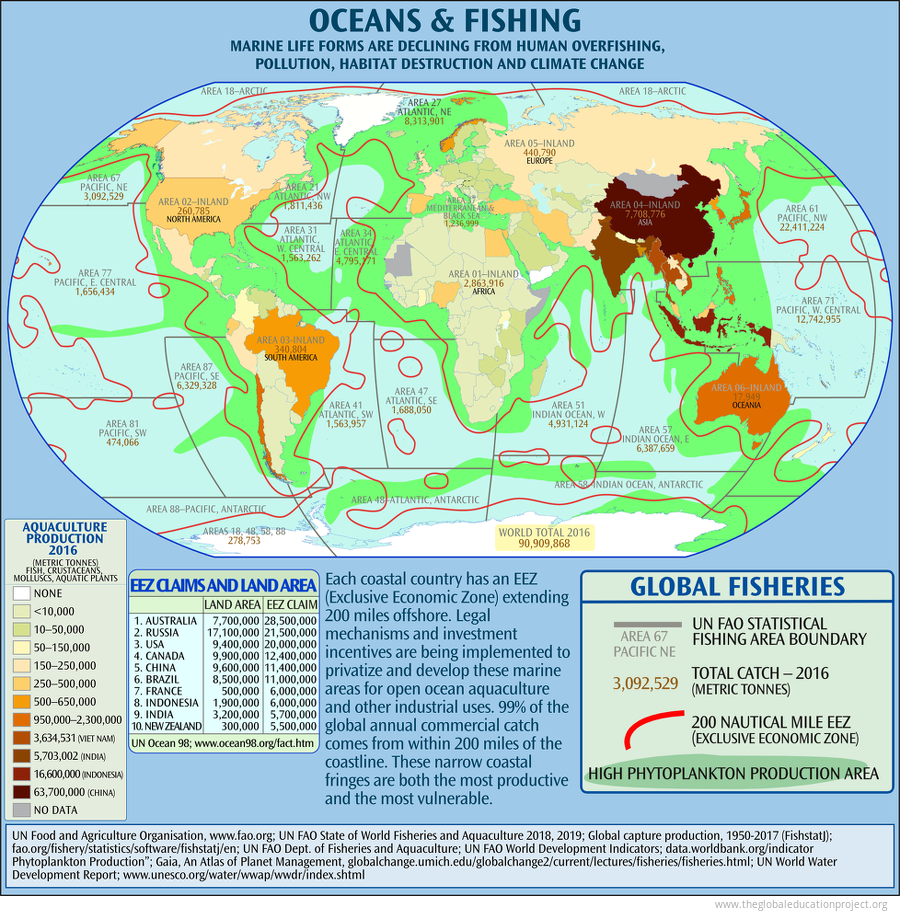 Each coastal country has an EEZ extending 200 miles offshore. “99% of the worldwide annual commercial ocean catch comes from coastal waters... these narrow coastal fringes are both the most productive and the most vulnerable.” Legal mechanisms and...
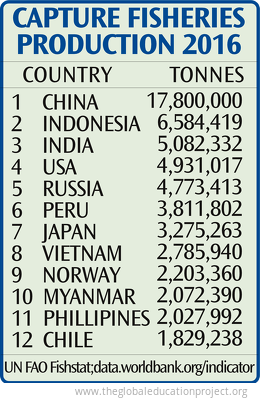
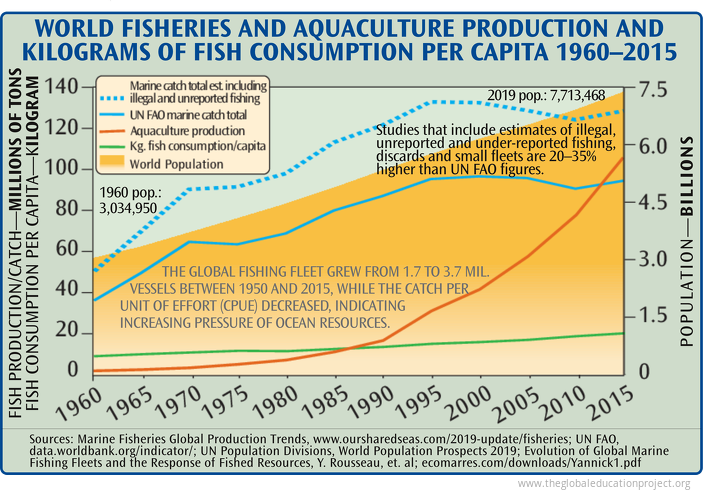
Fisheries and aquaculture; fish consumption and utilization; what countries claim as Exclusive Economic Zones (EEZs), and how heavily the world's fish stocks are being exploited; oil in the ocean; coral reefs.
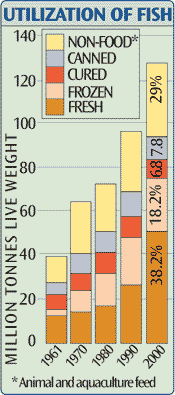 In 2017 around 22% of total global capture fisheries were used for non-direct human use, including fishmeal and direct feed, a large portion of which is used in aquaculture production.
"If four tonnes of wild caught anchovies are required as feed to...
 The high protein feed for farmed salmon is largely composed of ocean caught fish meal and meat offal from poultry and hog processing. Because of bio-accumulation of toxins in the feed, "consumption of farmed salmon even at relatively low frequencies results...
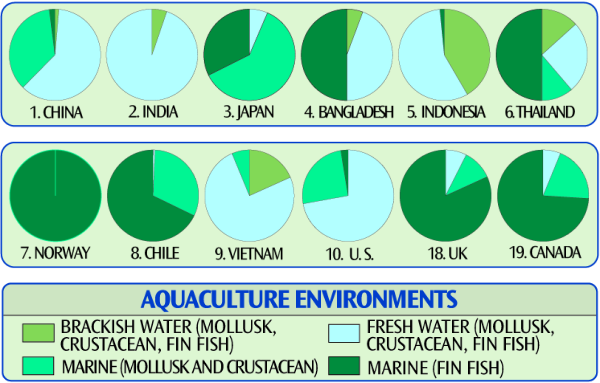
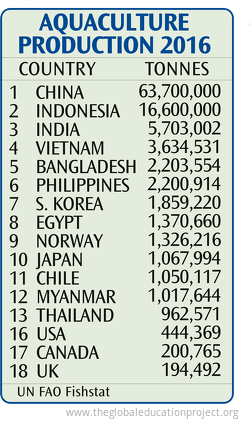 AQUACULTURE is the industrial farming in fresh or salt water of fish, mollusks, crustaceans and plants.
Aquaculture is rapidly increasing its annual global harvest and seems to offer hope for increased food production. However, for some of the more than...
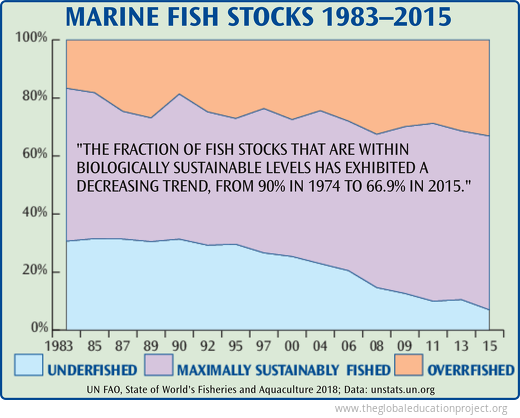
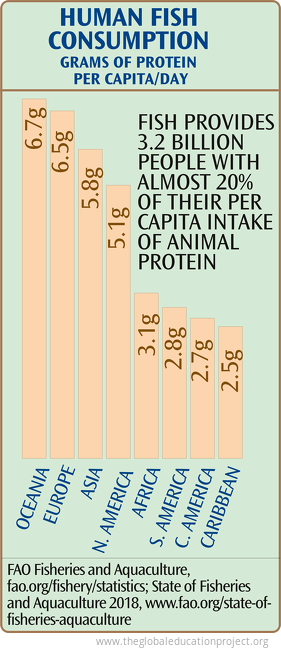 In 2015, fish accounted for about 17% of animal protein, and 7% of all proteins, consumed by the global population. Since 1961, the global average annual increase in fish consumption for food has outpaced population growth and exceeded consumption of...
Page 1 of 1
Sign up for EARTH Dispatches
Enter you email below to get jaw dropping charts and maps delivered straight to your inbox.
Get the EARTH presentation
A 150 page high-resolution PDF containing all updated maps, charts and data on EARTH website; use as an information-packed educational slide show, printed booklet or a set of single-page handouts.
Learn More
