Fossil Fuel
Industrialized civilization is dependent upon cheap and reliable fossil fuel energy. This section includes a look at production, consumption, remaining known resources and the global carbon budget.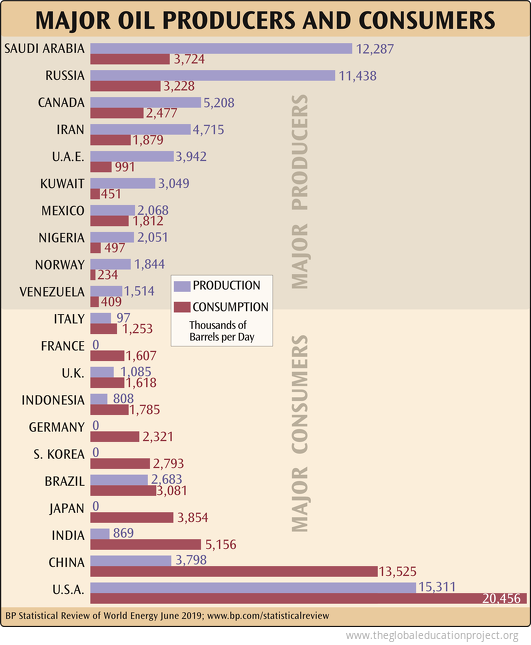 Coal has been used since the industrial revolution but only in the last 100 years have huge quantities of oil and gas been removed from underground reservoirs. Oil and gas are used as fuel energy in combustion engines and as "feed stock" for other industries — raw materials for the manufacture of other chemicals, such as plastics and agricultural fertilizer. There is a limited amount of fossil fuel. It is not "renewable" and there is no known way to make more. The energy stored in oil is significantly greater than in any other currently available source. There is no other equivalently cheap and powerful energy available from nuclear energy, natural gas, solar power, wind power, hydrogen, biomass or coal.
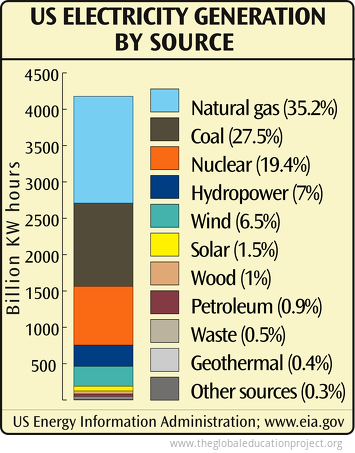
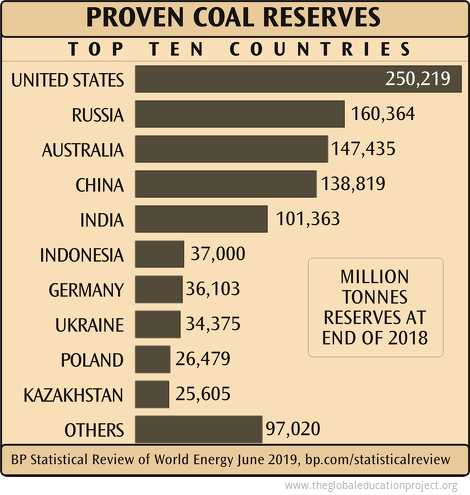 In 2014, coal-powered plants at electrical utilities in the US accounted for 39% of electricity production, 27.5% in 2018, and 23.5% in 2019. The decline is due to increased availability of natural gas, decreased consumption, increase in renewable power, and the closing of some coal plants due to more stringent environmental regulations.
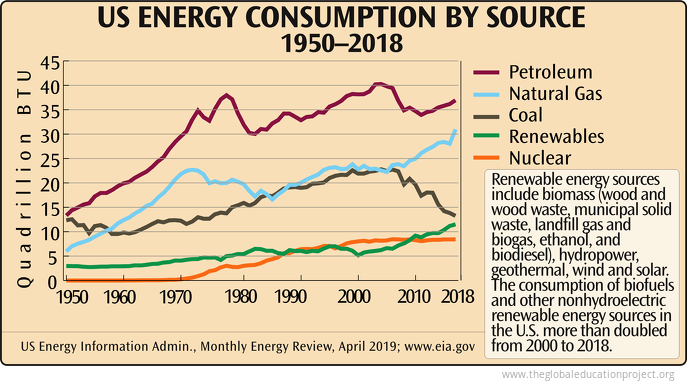
In 2019, US annual energy consumption from renewable sources exceeded coal consumption for the first time since before 1885, mostly from the growing use of wind and solar.
Coal plants, in addition to mercury, emit tons of other toxins including vanadium, barium, zinc, lead, chromium, arsenic, nickel, hydrogen fluoride, hydrochloric acid, ammonia and selenium.
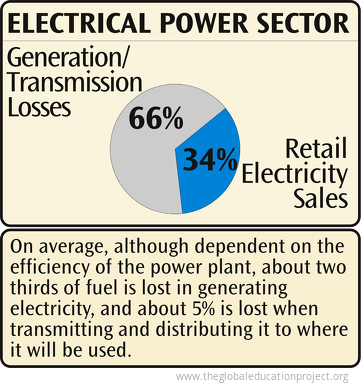
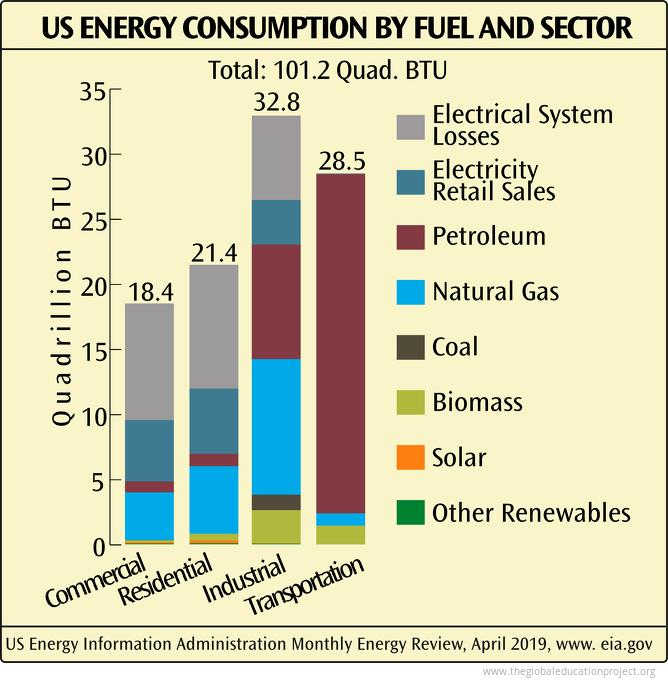
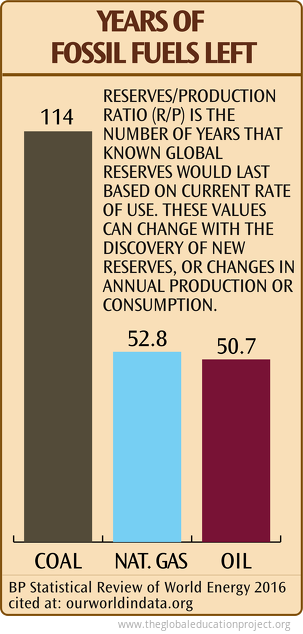
HOW IMPORTANT IS “PEAK OIL” ?
Economic development and prosperity over the past century has been built on cheap and abundant oil-based energy. With rising populations and continued industrial development the demand for oil will continue to increase. After the production peak, as supplies decline, prices rise and the effects on climate are increasingly urgent, the world will have to use less fossil fuel or find alternate sources of energy.Possible choices include nuclear power, hydroelectricity, wind, tide, solar, geothermal, biomass, hydrogen and over-unity energy sources.
To date, although many of the alternatives are cleaner, none are as cheap, convenient or as energy rich as oil–although some solar panel projects can generate power at roughly half the cost of fossil fuels like coal.
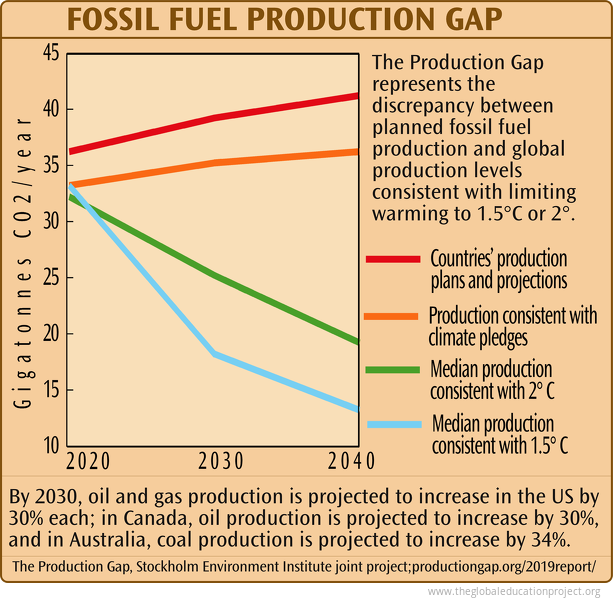 Countries are planning to produce about 50% more fossil fuels by 2030 than would be consistent with a 2°C global average temperature rise, and 120% more than would be consistent with a 1.5°C rise.
The production gap is largest for coal. By 2030, countries plan to produce 150% more coal than would be consistent with a 2°C global average temperature rise, and 280% more than would be consistent with a 1.5°C rise.
Sources
Major Oil Producers and Consumers Chart:
BP Statistical Review of World Energy, June 2019; www.bp.com/statisticalreview
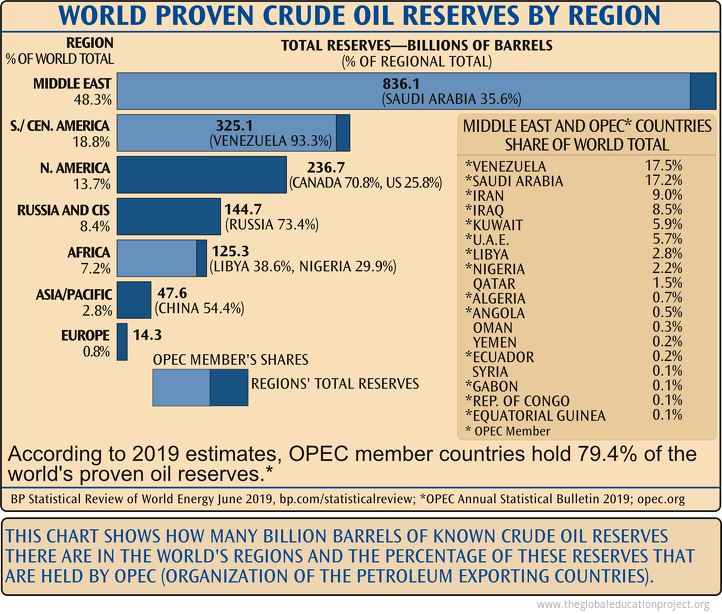
Crude Oil Reserves by Region Chart:
BP Statistical Review of World Energy, June 2019; www.bp.com/statisticalreview
Proven Coal Reserves Chart:
Chart: BP Statistical review of world energy June 2019; bp.com/statisticalreview
Text: US Energy Information Adminstration; eia.gov
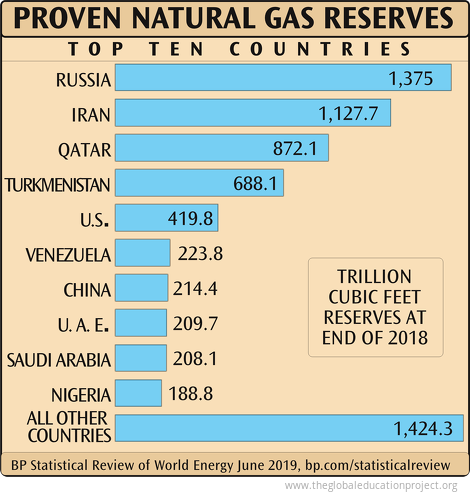
Proven Natural Gas Reserves Chart:
BP Statistical Review of World Energy, June 2019; www.bp.com/statisticalreview
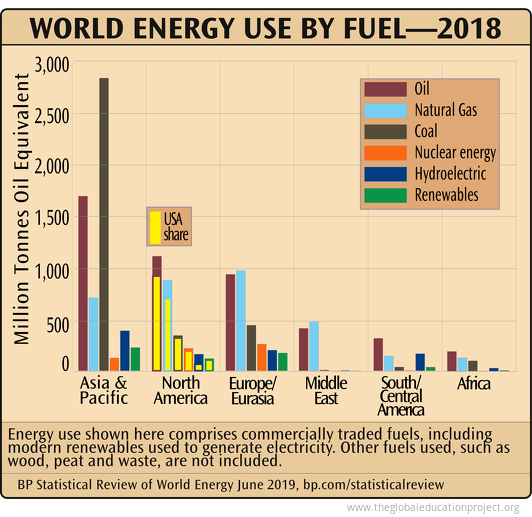
World Energy Use By Fuel Chart:
BP Statistical Review of World Energy 2019; www.bp.com/statisticalreview
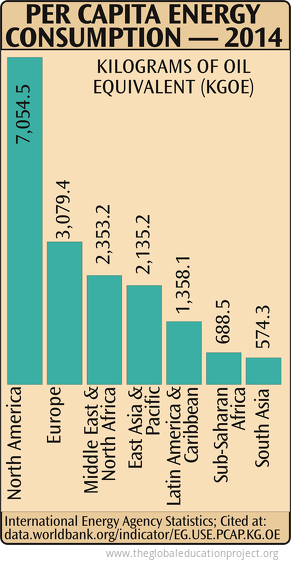
Per Capita Energy Consumption 2014 Chart:
International Energy Agency Statistics; cited at: data.worldbank.org/indicator/EG.USE.PCAP.KG.OE
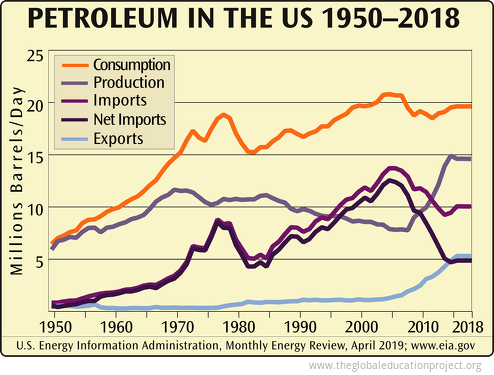
Petroleum in the US 1950–2018 Chart:
U.S. Energy Information Administration, Apr. 2019; www.eia.gov
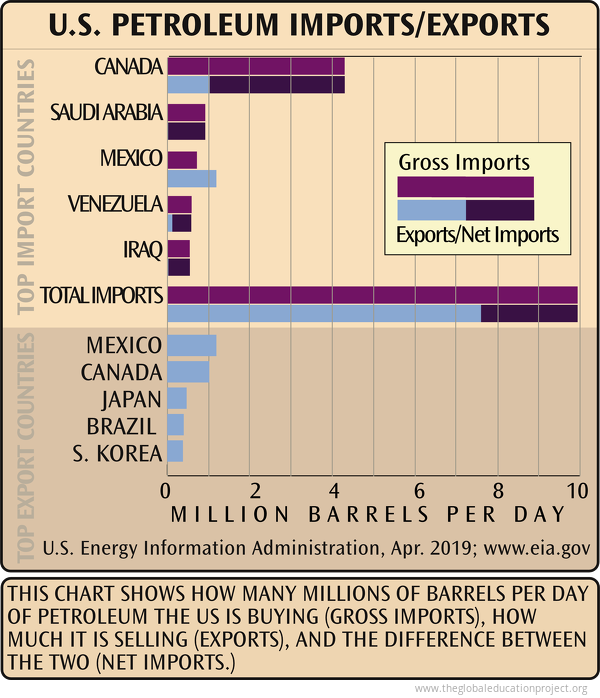
U.S. Petroleum Top Imports and Exports Chart:
U.S. Energy Information Administration, Apr. 2019; www.eia.gov
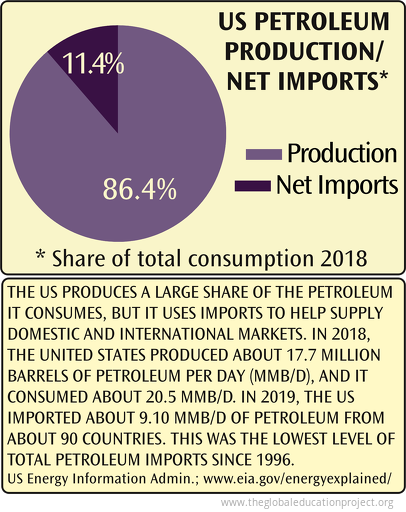
US Petroleum Production and Net Imports 2018 Chart:
US Energy Information Administration; www.eia.gov/energyexplained/
US Energy Consumption by Source 1950-2018 Chart:
US Energy Information Administration; Monthly Energy Review, April 2019; www.eia.gov
US Electricity Generation Chart:
US Energy Information Administration; www.eia.gov
US Electrical Power Sector Chart:
US Energy Information Administration; www.eia.gov
US Energy Consumption by Fuel and Sector Chart:
U.S. Energy Information Administration, Monthly Review, Apr. 2019; www.eia.gov
HOW IMPORTANT IS “PEAK OIL” ? Text:
Association for the Study of Peak Oil; www.asponews.org
Years of Fossil Fuels Left 2016 Chart:
BP Statistical Review of World Energy 2016 www.bp.com/statisticalreview, cited at: ourworldindata.org
Fossil Fuel Production Gap Chart:
The Production Gap, Stockholm Environment Institute joint project; productiongap.org/2019report/
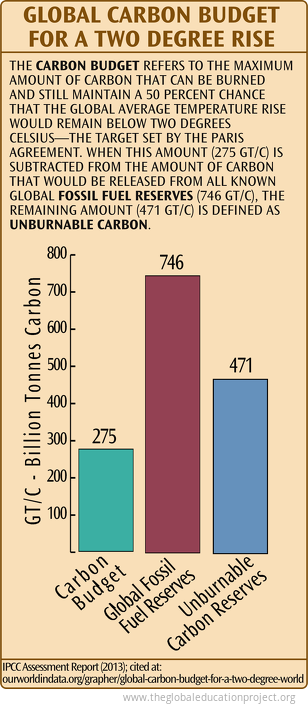
Global Carbon Budget Chart:
IPCC Assessment Report (2013); ourworldindata.org/how-long-before-we-run-out-of-fossil-fuels
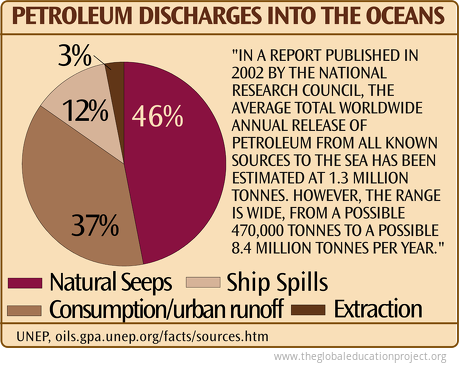
Petroleum Discharges into the Oceans Chart:
UNEP; oils.gpa.unep.org/facts/sources.htm
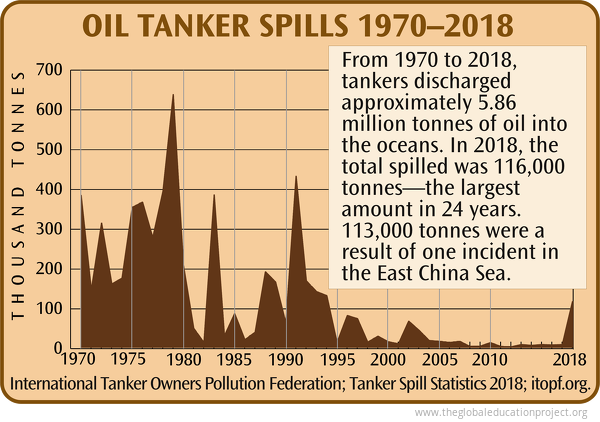
Oil Tanker Spills Chart:
International Tanker Owners Pollution Federation; Tanker Spill Statistics 2018; itopf.org
Tags: fossil fuel
Sign up for EARTH Dispatches
Enter you email below to get jaw dropping charts and maps delivered straight to your inbox.
Get the EARTH presentation
A 150 page high-resolution PDF containing all updated maps, charts and data on EARTH website; use as an information-packed educational slide show, printed booklet or a set of single-page handouts.
Learn More
