Wealth & Inequality
Wealth is more concentrated, and the gap between rich and poor continues to widen. In this section: a comparison of the world's largest corporations and the most powerful countries; distribution of wealth; income inequality; prison incarceration rates; and use of police force in the US.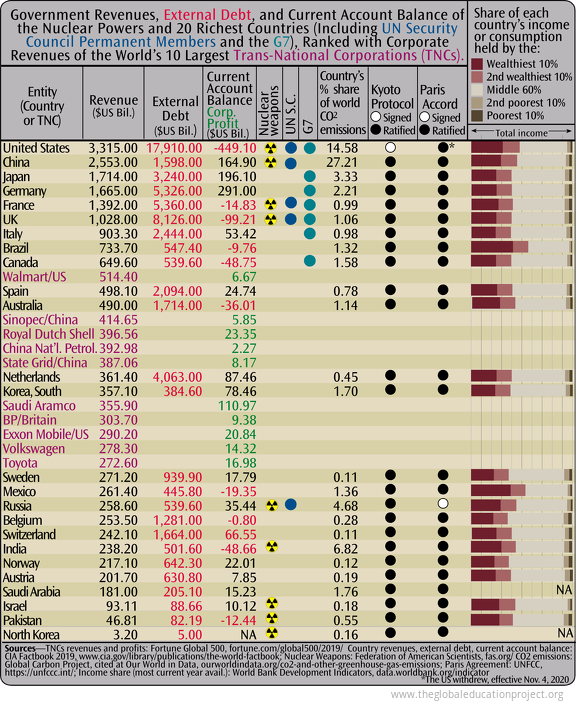 The above chart compares the world's largest trans-national corporations with the wealthiest countries and nuclear powers: Revenue, Debt, Wealth Inequality, and CO2 Emissions.
Percentage of the Population Living in Slums
Although the proportion of the urban population living in slums worldwide fell from 28% in 2000 to 23% in 2014, the number of people living in slums rose from 792 million to an estimated 880 million over the same period. In Least Developed Countries, nearly two-thirds (62%) of urban dwellers live in slum conditions.The UN defines a slum household as a group of individuals living under the same roof with one or more of the following conditions: lack of access to improved water; lack of access to improved sanitation; insufficient living area; and lack of durability of housing.
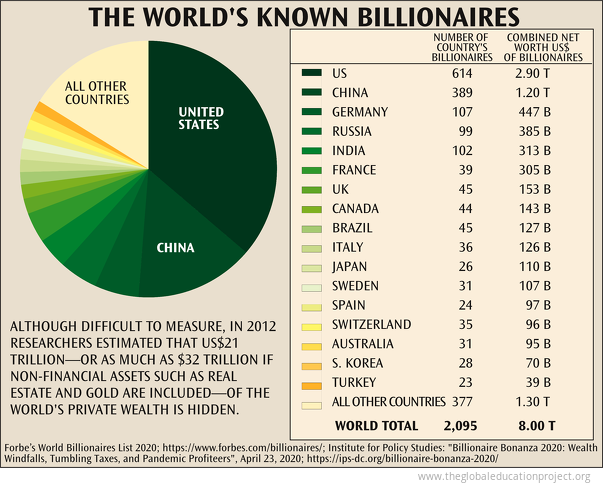 In 2021, the number of billionaires on Forbes’ annual list of the world’s wealthiest rose to 2,755—660 more than a year ago. Total worth is $13.1 trillion, up from $8 trillion on the 2020 list.
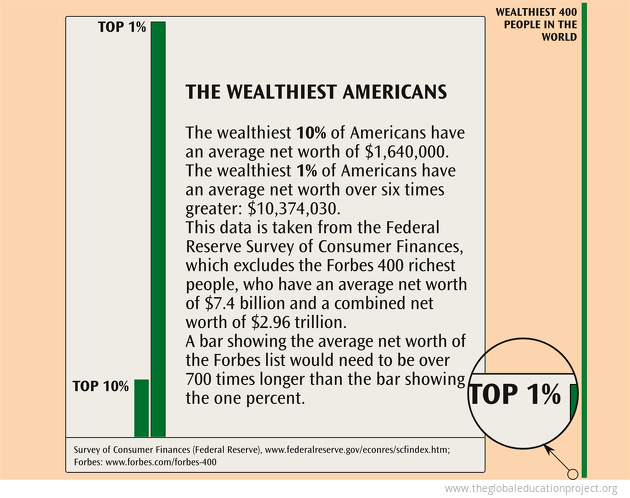
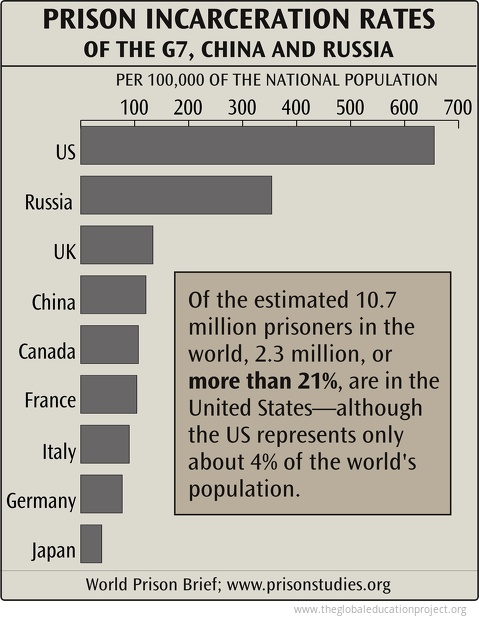
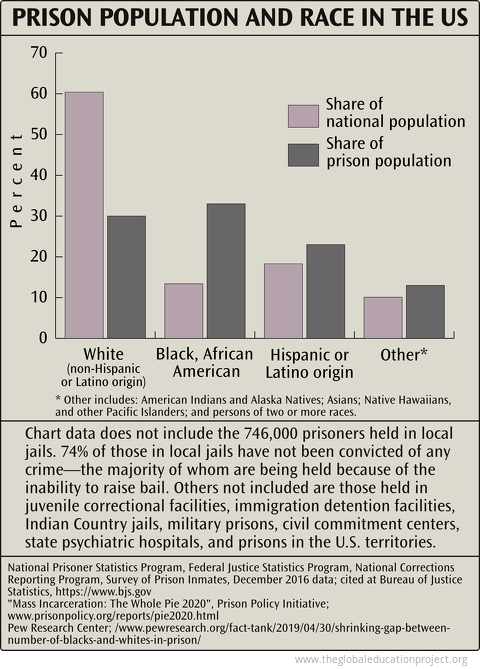 Chart data does not include the 746,000 prisoners held in local jails. 74% of those in local jails have not been convicted of any crime—the majority of whom are being held because of the inability to raise bail. Others not included are those held in juvenile correctional facilities, immigration detention facilities, Indian Country jails, military prisons, civil commitment centers, state psychiatric hospitals, and prisons in the U.S. territories.
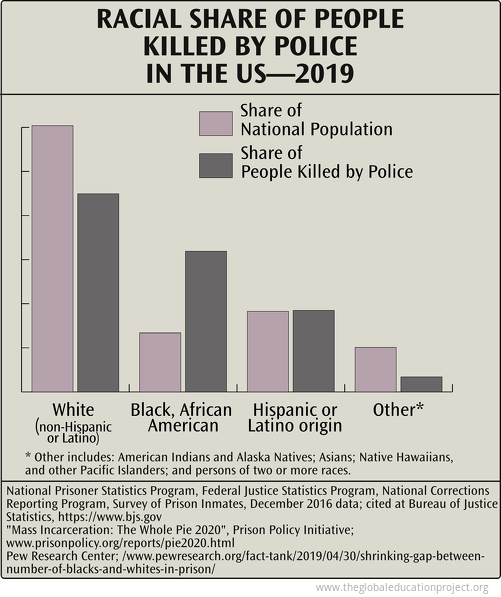
 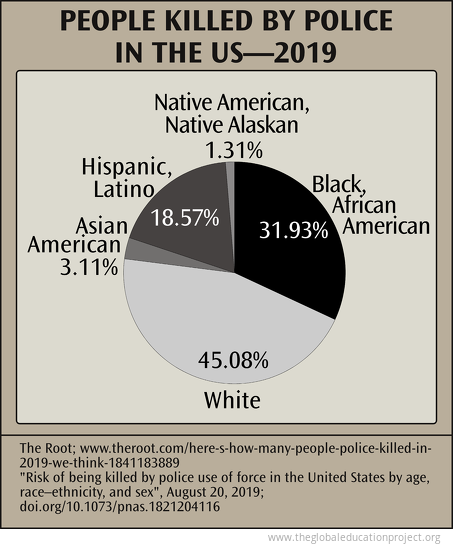 In 2018 in the United States, 996 people were killed by police, including: 399 White people, 209 Black people and 148 Hispanic people.
 In 2019, 1,004 were killed by police including: 370 White people, 235 Black people, and 158 Hispanic people.
As of August 30, 2020, 661 people have been killed by police, including: 242 White people, 123 Black people, and 80 Hispanic people.
Lifetime Risk of Being Killed by Police Use of Force in the US
A 2018 study using available data on police-involved deaths created models to estimate the lifetime risk of being killed by police. For young men of colour, police use of force is among the leading causes of death.Among all groups, black men and boys face the highest lifetime risk of being killed by police—about 1 in 1,000 over the life course, or about 96 per 100,000.
Risks to other groups are as follows:
American Indian/Alaska Native men and boys—between 36 and 81 per 100,000;
Hispanic/Latino men and boys—about 53 per 100,000;
White men and boys—about 39 per 100,000; Asian/Pacific Islander men and boys—between 9 and 23 per 100,000.
Sources
Revenue, Debt, Inequality, and CO2 Emissions of the most Powerful Countries and Corporations Table:
TNCs revenues and profits: Fortune Global 500, fortune.com/global500/2019/
Country revenues, external debt, current account balance: CIA Factbook 2019, www.cia.gov/library/publications/the-world-factbook
Nuclear Weapons: Federation of American Scientists, fas.org
CO2 emissions: Global Carbon Project, cited at Our World in Data, ourworldindata.org/co2-and-other-greenhouse-gas-emissions;
Paris Agreement: UNFCC, https://unfccc.int/
Income share (most current year avail.): World Bank Development Indicators, data.worldbank.org/indicator
GDP per Capita Chart:
World Bank national accounts data, and OECD National Accounts data; data.worldbank.org/indicator/NY.GDP.MKTP.KD; www.worldbank.org/en/country/mic
Percentage of the Population Living in Slums Text:
Environmental Research Foundation, www.ejnet.org/rachel/rhwn256.htm
UNESCO World Water Assessment Programme, Office for Global Water Assessment; www.unesco.org/water/wwap
Net Worth of Known Billionaires Chart:
Forbe’s World Billionaires List 2020; https://www.forbes.com/billionaires/
Institute for Policy Studies: "Billionaire Bonanza 2020: Wealth Windfalls, Tumbling Taxes, and Pandemic Profiteers", April 23, 2020; https://ips-dc.org/billionaire-bonanza-2020/
Percentage of Wealth Held by Richest and Poorest Americans Chart:
National Bureau of Economic Research; cited at: inequality.org/facts/wealth
Net Worth of American Households Chart:
Survey of Consumer Finances (Federal Reserve), www.federalreserve.gov/econres/scfindex.htm;
US Census Bureau; www.census.gov/
American Household Income Distribution Chart:
US Census Bureau, Table A-2. Households by Total Money Income, Race, and Hispanic Origin of Householder: 1967 to 2018; www.census.gov/library/publications/2019/demo/p60-266.html
The Wealthiest Americans Chart:
Survey of Consumer Finances (Federal Reserve), www.federalreserve.gov/econres/scfindex.htm;
Forbes: www.forbes.com/forbes-400
Prison Incarceration Rates Chart:
World Prison Brief; www.prisonstudies.org
Prison Population and Race in the US Chart:
National Prisoner Statistics Program, Federal Justice Statistics Program, National Corrections Reporting Program, Survey of Prison Inmates, December 2016 data; cited at Bureau of Justice Statistics, https://www.bjs.gov
"Mass Incarceration: The Whole Pie 2020", Prison Policy Initiative; www.prisonpolicy.org/reports/pie2020.html
Pew Research Center; www.pewresearch.org/fact-tank/2019/04/30/shrinking-gap-between-number-of-blacks-and-whites-in-prison/
People Killed by Police in the US Chart:
Killed by Police; https://killedbypolice.net/
The Root; www.theroot.com/here-s-how-many-people-police-killed-in-2019-we-think-1841183889
"Risk of being killed by police use of force in the United States by age, race–ethnicity, and sex", August 20, 2019; doi.org/10.1073/pnas.1821204116
Racial Share of People Killed by Police in the US Chart:
Killed by Police; https://killedbypolice.net/
The Root; www.theroot.com/here-s-how-many-people-police-killed-in-2019-we-think-1841183889
Text:
Killed by Police, https://killedbypolice.net/
Lifetime Risk of Being Killed by Police Use of Force in the US Text:
"Risk of being killed by police use of force in the United States by age, race, ethnicity, and sex", August 20, 2019; doi.org/10.1073/pnas.1821204116
Killed by Police, https://killedbypolice.net/
Tags: wealth, race, inequality, prison incarceration, police, people killed by police, distribution of wealth, billionaires, wealth & inequality
Sign up for EARTH Dispatches
Enter you email below to get jaw dropping charts and maps delivered straight to your inbox.
Get the EARTH presentation
A 150 page high-resolution PDF containing all updated maps, charts and data on EARTH website; use as an information-packed educational slide show, printed booklet or a set of single-page handouts.
Learn More
