Oceans
The essential data about oceans explained in 4 infographics. Detailed charts and maps covering petroleum discharges into the oceans, terrestrial and ocean biomes, mismanaged plastic waste, global aquaculture and fisheries and more. Learn the truth about oceans and how it relates to the state of the world on The Global Education Project website with un-biased facts from the most reliable sources.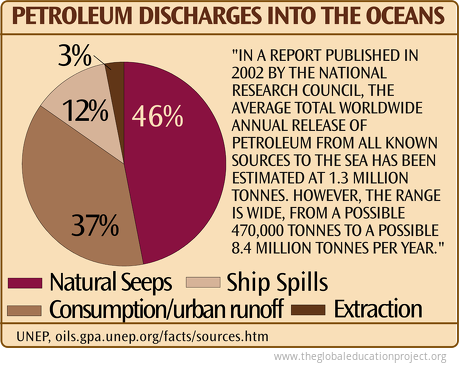
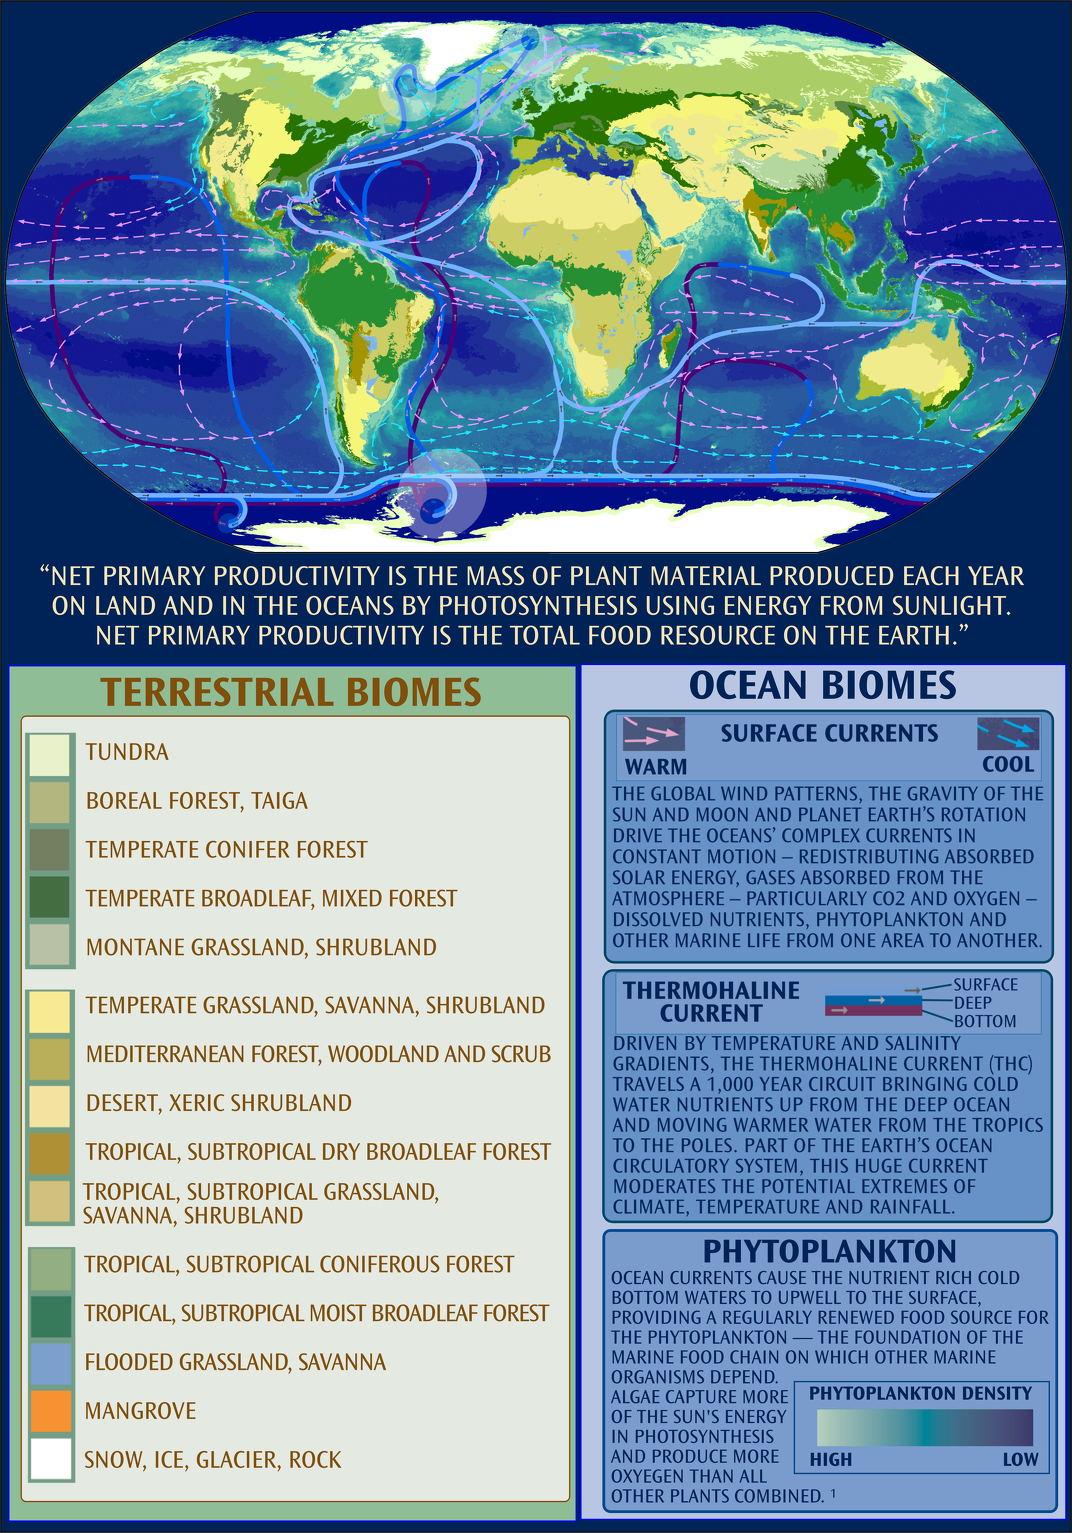 Evidence is growing that the thermohaline circulation, driven by temperature and salinity, could be slowed or stopped by cold fresh water inputs to the Arctic and North Atlantic oceans, diluting the salt concentration in the ocean. This could occur if...
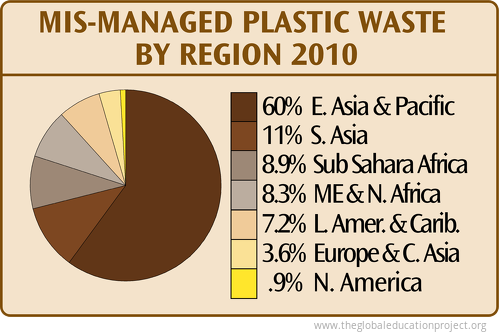 The amount of plastic debris that ends up in the oceans from the land is mostly determined by population size living within 50km of a coast and by the amount of plastic waste that is mismanaged—either littered or disposed into uncontained dumps or landfills....
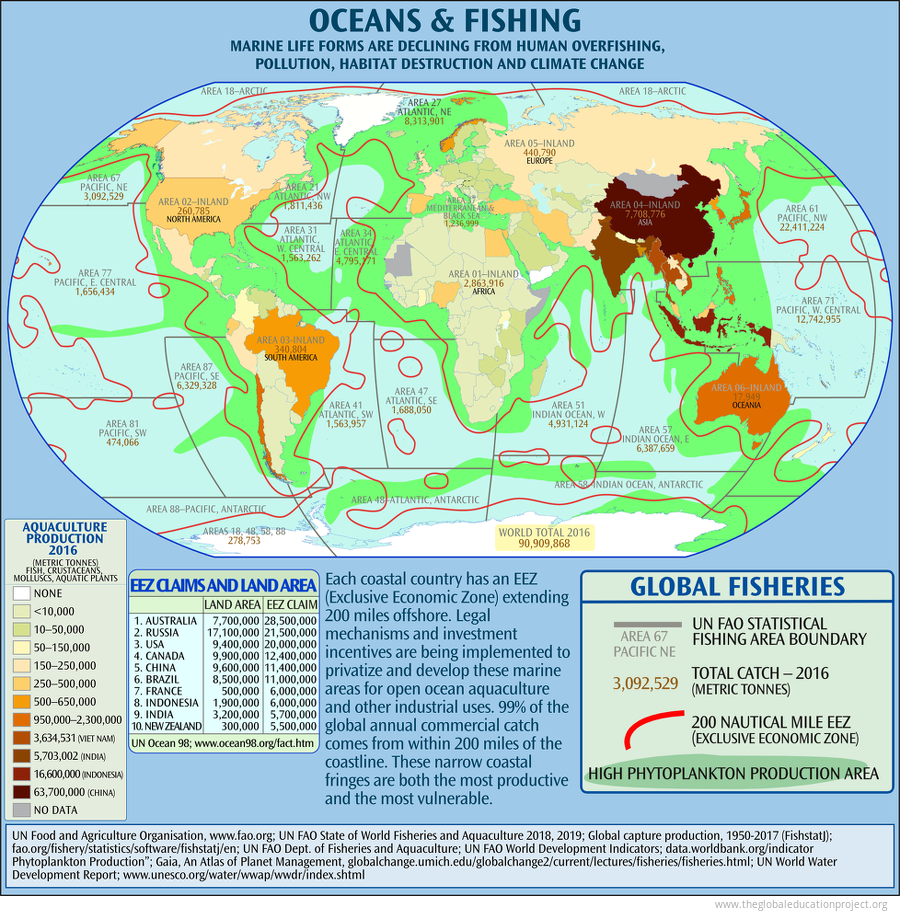 Each coastal country has an EEZ extending 200 miles offshore. “99% of the worldwide annual commercial ocean catch comes from coastal waters... these narrow coastal fringes are both the most productive and the most vulnerable.” Legal mechanisms and...
Page 1 of 1
Sign up for EARTH Dispatches
Enter you email below to get jaw dropping charts and maps delivered straight to your inbox.
Get the EARTH presentation
A 150 page high-resolution PDF containing all updated maps, charts and data on EARTH website; use as an information-packed educational slide show, printed booklet or a set of single-page handouts.
Learn More
