graphs for an individual country
The
"HDI" ranks the relative "development" of the world's countries (Norway is #1, Jordan is #92, Sierra Leone is #174.) It is based on three indicators: longevity, as measured by life expectancy at birth; educational attainment, measured by a combination of adult literacy rate (two thirds weight) and combined gross primary, secondary and tertiary enrolment in schools (one third weight); and standard of living, as measured by GDP per capita – PPP (purchasing power parity) US$. HDI is tabulated in the “Human Development Report” and commissioned annually by the United Nations Development Program. (“Human Development Report 2000,” Table 1, <www.undp.org/HDRo/HDR2000.html>)
Country Graph Sources:
(WDI)
World Bank's "World Development Indicators"
Major Sources for the UNDP Human Development Report:
(IMF)
International Monetary Fund : much of the economic data
(LIS)
Luxembourg Income Study
: income poverty estimates
(OECD)
Organisation for Economic Co-operation and Development
: aid, employment, illiteracy
(UNICEF)
United Nations Children's Fund : monitors the well-being of
children, provides a wide array of data
World Bank: primary source for a number
of the economic indicators
(WHO)
World Health Organization
: health related issues
World Resources Institute
: environmental
issues
Additional Statistics on Palestine:
In developing countries "poverty" includes people living under a nationally established poverty line or those with an income of less than US$1.00 a day. In developed countries this includes those with an income of less than US$14.40 day, or less than US$4.00 a day.) - (HDR Tables 4 and 5)
GNP - Human Development Report, Table 13;
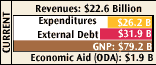
Revenues - CIA World Factbook
Expenditures - HDR Table 14 and CIA World Factbook
External Debt and Economic Aid (ODA: Official Development Assistance) - HDR Table 18, or from the CIA World Factbook; 1998 and 1999 data.
Central government expenditure relative to the country's GNP
External debt (total public debt owed outside the country) shown relative to GNP
Gross National Product (GNP)
the colour of the GNP bar indicates a dollar amount
Share of
income or consumption
(HDR table 4)
Percentage of people in the country who have no access to safe drinking water
(HDR table 4)
Percentage of children under five who are moderately to severely stunted (SWC table 2)
Percentage of the people in the country who live in poverty (HDR tables 4 and 5)
Human Develop Index (HDI)
How long the average person can expect to live in this country
(HDR table 1)
Percentage spent on debt servicing -
interest and principal paid on public debts owed to multi-lateral institutions (IMF, World Bank etc), other governments, and bankers outside the country.
(SWC Table 6 and HDR Table 18)
Central Government spending
Percentage spent on health
Percentage spent on military
Percentage spent on education
NOTE:in some cases, where debt service data is unavailable, data for interest payments only has been used. (WDI TABLE 4.12)